Foehn and paragliding: why 4 hPa is not enough and what 20 foehn valleys measured
WingcastUpdated 2026-10-1130 min read
In short: Foehn is a warm, dry downslope wind on the lee side of the Alps. It is dangerous for pilots because it often already blows above the valley while the launch site is still calm. If there is a cold-air pool in the valley, the foehn flows over it and can break through to the ground without warning. We analysed the MeteoSwiss foehn index in 20 foehn valleys for 2020 to 2025. The rule of thumb "foehn from 4 hPa of pressure difference" does not hold up. With 4 to 6 hPa between Lugano and Zürich, foehn reached the valley floor in Altdorf only 10 % of the time. So the pressure difference tells you that a foehn situation is possible, but not whether the foehn will reach your valley. The ICON-CH1 and ICON-CH2 models do not show it reliably either. In the foehn event of August 2026 they got the wind direction right almost every time, but their gusts were a median of almost 8 km/h too low. So when you read the forecast, look for wind from the foehn direction and dry air, even if the wind looks weak.
What foehn is
Foehn is a warm and above all dry downslope wind on the side of a mountain range that faces away from the flow. It forms wherever strong winds blow across a mountain chain, and it often reaches storm force [1]. On the north side of the Alps it is called south foehn, after the direction it comes from. On the south side of the Alps it is called north foehn. With south foehn, air pressure is higher south of the Alps than north of them, and the air flows across the Alps towards the north. With north foehn it is the other way round. Where the high and low pressure systems sit varies from one situation to the next [1].
How foehn forms: the air's journey over the ridge
The easiest way to explain foehn is to follow the air on its journey. Here is the example of south foehn:
- Windward side: The air is lifted on the south side of the Alps. If it is moist, clouds form and it rains. Seen from the north, this bank of cloud sitting on the ridge is the foehn wall [1].
- Ridge: The flow is forced over and through the passes. A useful picture is the hydraulic theory of foehn: like water over a weir, the foehn air near the ground shoots over the ridge and can slow down again in a sudden jump on the lee side [2].
- Lee side: The air sinks and warms up as it does. The clouds dissolve and the foehn window opens, with very clear air [1].
- Waves: Behind the ridge the flow swings up and down. Lens-shaped clouds often form on the wave crests. These are lenticular clouds, also called "foehn fish" [1].
- Rotors: Close to the ground beneath the waves, the air rolls up into horizontal eddies. The German weather service (DWD) calls these rotors a frequent companion of lee waves. Their up- and downdrafts can cause severe turbulence for paragliders [3].
Video
The journey of foehn air and what it means for your flight
Why foehn does not reach every valley
A central question in foehn research has always been why the warm, light air descends into the valley at all and pushes out the cold, heavy air there [1]. Often it does not. If there is a cold-air pool in the valley, the foehn first flows over the top of it. The SHV (Swiss Hang Gliding Association) writes that cold-air pools are at first overrun by the foehn, and that the foehn can break through by surprise [7].
Whether and how often it breaks through depends on the terrain. For the inner-Alpine foehn stations, MeteoSwiss found a correlation of minus 0.96 between foehn frequency and the height difference to the relevant pass: the further a station lies below the pass, the less often the foehn reaches it [8]. In April and May, the months with the most foehn, Altdorf shows a foehn minimum in the morning and a maximum in the evening [8].
How MeteoSwiss measures foehn
The foehn index is calculated every ten minutes and has three levels: 0 = no foehn, 1 = mixed foehn air, 2 = foehn. For south foehn the basic requirement is a south wind on the main Alpine ridge at Gütsch above Andermatt. On top of that come wind, gusts, direction, humidity and potential temperature at the valley station, compared with Gütsch [9], [10]. The criteria for north foehn are not published. Air pressure does not appear anywhere in the published method. That makes the index a clean way to test how well the pressure difference predicts foehn.
Why foehn is dangerous for paragliders
For flying, what counts with foehn is the airflow. Four things make it dangerous, and you cannot reliably see any of them from the launch site.
The wind is strong. Foehn storms are nothing unusual in the foehn valleys. In Altdorf the strongest gusts reach 100 to 140 km/h every year [1]. That is far above the speed a paraglider flies.
The lee side is turbulent. Lee waves and rotors produce strong up- and downdrafts [3]. The rotors reach down close to the ground, exactly where you launch and land.
There is wind shear at the boundary with the cold air. When foehn blows over a cold-air pool, two air masses with different direction and speed lie on top of each other. The DWD describes strong wind shear over such pockets of cold air on the lee side [3]. At a launch site inside the cold-air pool it is calm. Above it, it is not.
The breakthrough comes without warning. When the foehn breaks through to the ground, it turns stormy within a short time. The SHV describes an exam day at Büelen in the canton of Nidwalden: less than 4 hPa of south overpressure in the forecast, not a word about foehn in the text forecasts, and still a "stubborn, slightly gusty south/southeast wind" at the launch site. In the same year there were accidents under similar signs [11].
So what you feel at the launch site often does not describe the air you are flying into.
The case: 26 to 28 August 2026
At the end of August 2026 a south foehn situation sat over Switzerland. The measured pressure difference between Lugano and Zürich rose above 7 hPa on the evening of the 27th. It peaked in the night to the 28th at 9.1 hPa at 01:00. In the same night, gusts of up to 96 km/h were measured on Gütsch. On the afternoon of the 28th the situation turned, and on the 29th the higher pressure was on the north side.
Case
Temperature, wind and pressure difference
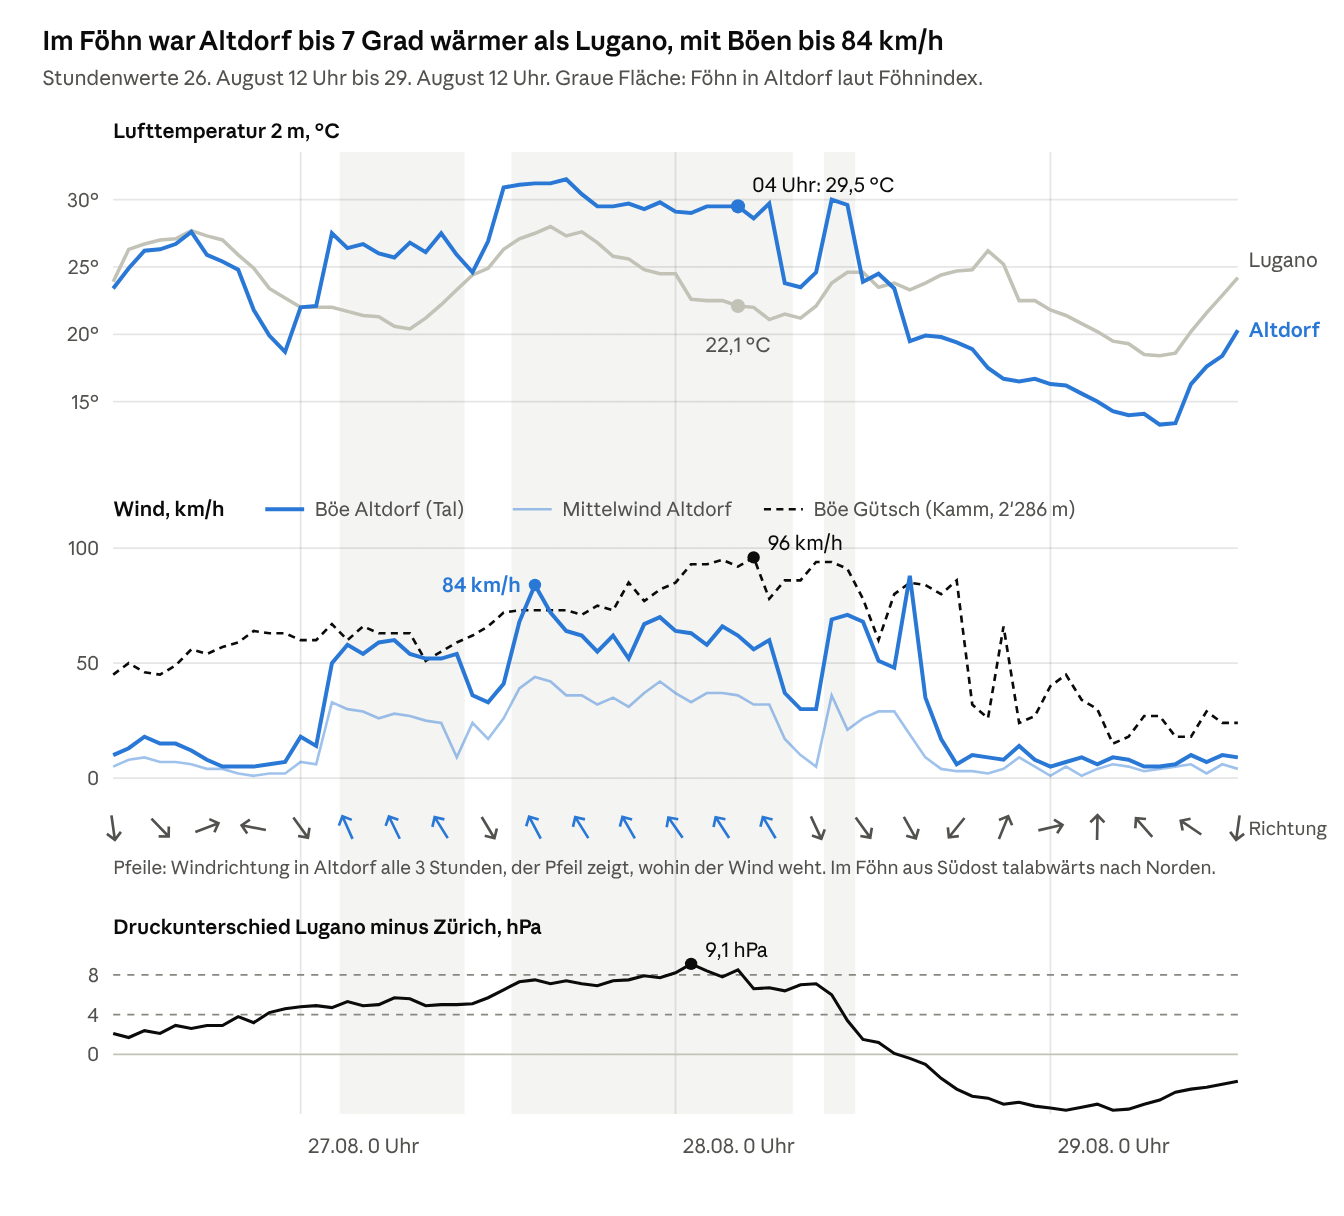
On Gütsch, up on the Alpine ridge, gusts of 45 to 64 km/h were already blowing on the afternoon of 26 August. In Altdorf they stayed below 20 km/h. At 02:00 on the 27th the foehn arrived down below: within one hour the gusts in Altdorf jumped from 14 to 50 km/h, and the wind turned southeast. On the afternoon of the 27th they reached 84 km/h, and on Gütsch in the night to the 28th even 96 km/h. After the foehn, on the afternoon of the 28th, the wind in Altdorf turned northwest, with a single gust of 88 km/h.
It came dry
On the south side of the Alps, ten measuring stations from Lugano to San Bernardino recorded practically no rain up to midnight from 27 to 28 August (0.2 mm at most). Only after that did 10 to 32 mm fall. So the first two foehn days were dry foehn. At 04:00 on 28 August, Altdorf had 29.5 °C at 36 % humidity. Lugano at the same time had 22.1 °C at 89 %.
When the foehn arrived where
For the analysis we use 20 foehn valley points: one per foehn valley, each placed on a station with an official foehn index, spread across the north side of the Alps, Valais and the south side. The table shows the 14 valleys on the north side and in Valais. At the six valley stations on the south side there was no foehn, as you would expect with south foehn. Valley names are given in German, as on the charts (oben = upper, unten = lower).
| Valley (station, altitude) | Foehn hours 26 to 29 Aug | First foehn report | Strongest gust during foehn |
|---|---|---|---|
| Reusstal (Altdorf, 438 m) | 26.8 h | 27 Aug, 01:50 | 84 km/h |
| Glarnerland oben (Elm, 958 m) | 26.3 h | 26 Aug, 23:50 | 63 km/h |
| St. Galler Rheintal (Vaduz, 457 m) | 24.7 h | 27 Aug, 12:00 | 82 km/h |
| Oberwallis (Visp, 639 m) | 21.8 h | 26 Aug, 17:10 | 72 km/h |
| Sarganserland (Bad Ragaz, 497 m) | 20.2 h | 27 Aug, 01:40 | 73 km/h |
| Davos (1594 m) | 17.5 h | 27 Aug, 10:50 | 50 km/h |
| Glarnerland unten (Glarus, 517 m) | 16.5 h | 27 Aug, 14:30 | 55 km/h |
| Domleschg/Schams (Andeer, 987 m) | 13.7 h | 26 Aug, 13:30 | 60 km/h |
| Churer Rheintal (Chur, 556 m) | 12.3 h + 10.7 h mixed air | 27 Aug, 11:40 | 62 km/h |
| Unterwallis (Evionnaz, 482 m) | 11.7 h | 26 Aug, 22:50 | 57 km/h |
| Haslital (Meiringen, 589 m) | 8.5 h, night only | 27 Aug, 19:20 | 86 km/h |
| Rheintal unten (Altenrhein, 398 m) | 2.7 h, night only | 27 Aug, 23:30 | 75 km/h |
| Mittelwallis (Sion, 482 m) | 0.7 h | 27 Aug, 18:30 | 35 km/h |
| Chablais (Aigle, 381 m) | no foehn |
Case
When the foehn blew where
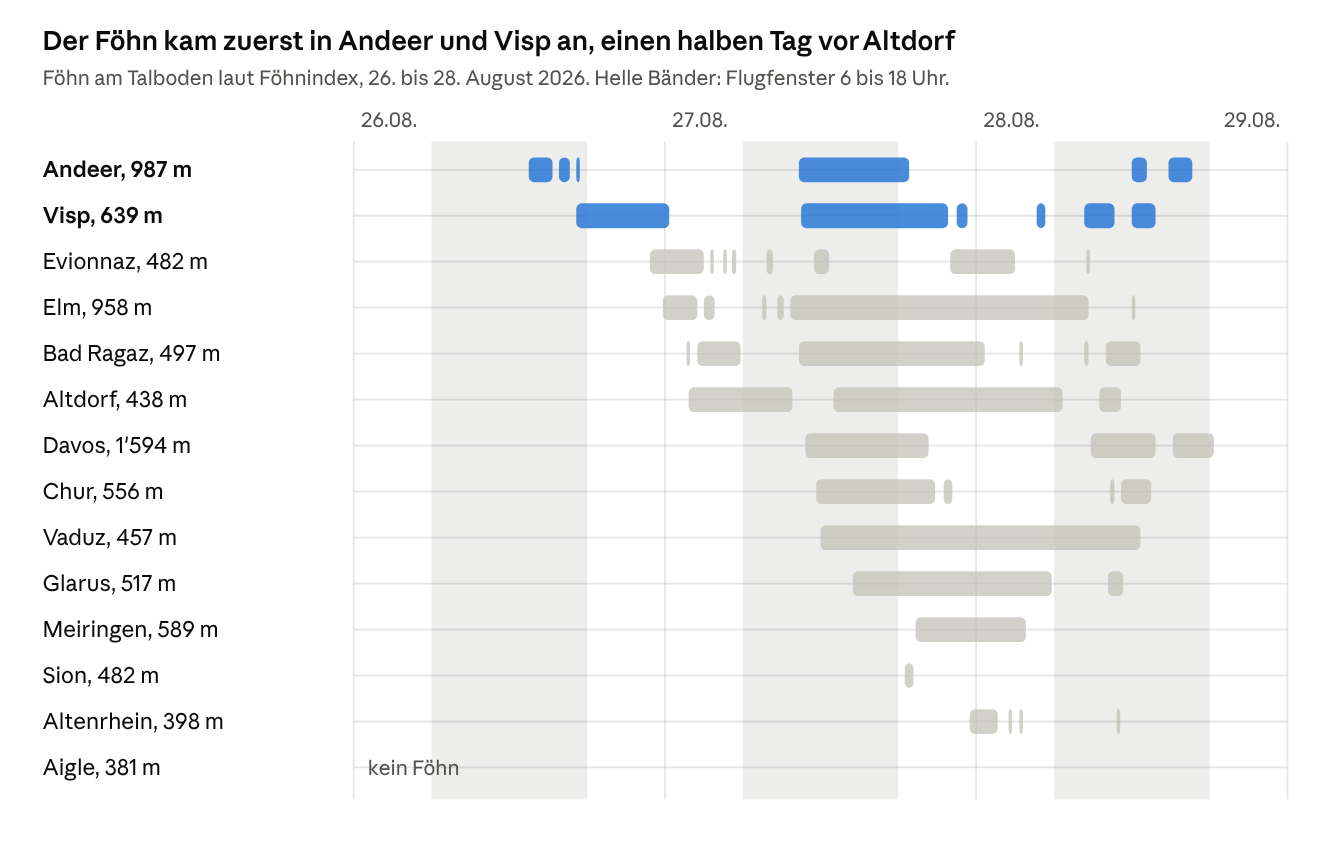
The foehn arrived first in the inner Alps, in Andeer on the afternoon of the 26th and in Visp in the early evening, with a pressure difference of no more than 3.0 hPa during flying hours. Neighbouring valleys were half a day apart. Bad Ragaz had foehn from 01:40 in the night to the 27th, while Chur, barely twenty kilometres away, only had it from 11:40. It weakened further down the valley, with 24.7 hours in Vaduz and 2.7 in Altenrhein on Lake Constance. Elm at 958 m had ten hours more foehn than Glarus at 517 m.
Storm above, calm below
The chart shows the strongest gust in the night to 28 August between 01:00 and 02:00, each time on a valley floor and at the nearest summit:
Case
Valley versus summit
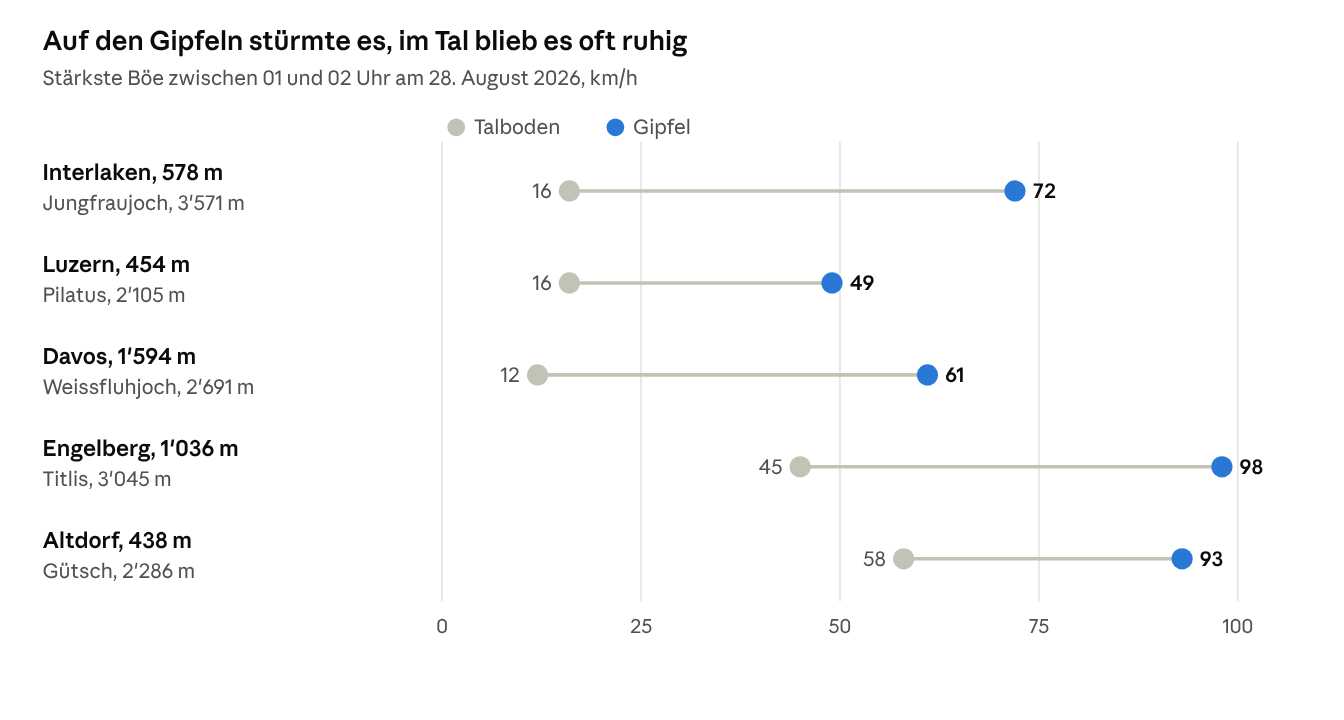
In Interlaken and Luzern (Lucerne) there was hardly any wind on the ground, while Pilatus had almost 50 km/h. There is no station at launch height in between. What it was like up there can only be narrowed down.
How much pressure difference does foehn need?
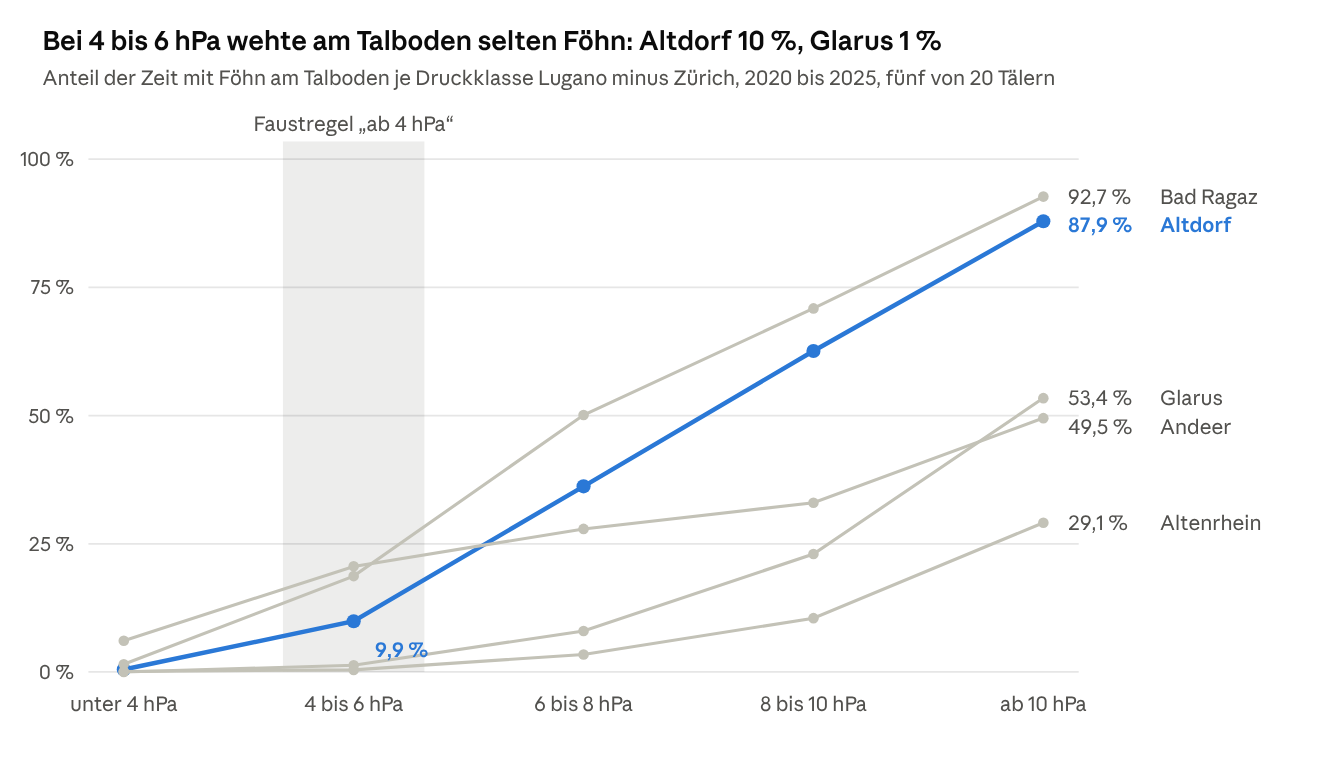
There is no fixed threshold. From 2020 to 2025, with 4 to 6 hPa of pressure difference across the Alps, none of the 20 foehn valleys had foehn on the valley floor more than a quarter of the time. Altdorf had it 10 % of the time, Vaduz 6 % and Glarus 1 %. Even from 10 hPa, foehn is not certain. Bad Ragaz and Altdorf had foehn in around nine out of ten measurements, Andeer and Davos in only half. The other way round, 39 % of all foehn hours in Andeer fell in periods with less than 4 hPa, 33 % in Davos and 30 % in Visp. The pressure difference tells you that a foehn situation is possible. It does not tell you whether the foehn will reach the ground in your valley.
One case is an anecdote. So for all 20 valley points we analysed the ten-minute values from 2020 to 2025 and assigned each measurement to a pressure class. The reference is the measured pressure difference Lugano minus Zürich, and the reverse for the north foehn valleys. The table shows the share of time in which foehn blew on the valley floor (index 2), and what share of all foehn hours occurred with less than 4 hPa.
Statistics
Foehn by pressure class
| Valley (station) | Side | Foehn hours per year | Foehn at 4 to 6 hPa | Foehn from 10 hPa | Foehn hours below 4 hPa |
|---|---|---|---|---|---|
| Reusstal (Altdorf) | North, south foehn | 350 | 10 % | 88 % | 4 % |
| Sarganserland (Bad Ragaz) | North, south foehn | 478 | 19 % | 93 % | 8 % |
| Churer Rheintal (Chur) | North, south foehn | 341 | 14 % | 64 % | 17 % |
| St. Galler Rheintal (Vaduz) | North, south foehn | 282 | 6 % | 84 % | 4 % |
| Rheintal unten (Altenrhein) | North, south foehn | 61 | 0.4 % | 29 % | 3 % |
| Glarnerland oben (Elm) | North, south foehn | 360 | 16 % | 70 % | 10 % |
| Glarnerland unten (Glarus) | North, south foehn | 122 | 1 % | 53 % | 1 % |
| Haslital (Meiringen) | North, south foehn | 184 | 4 % | 65 % | 4 % |
| Domleschg/Schams (Andeer) | North, south foehn | 472 | 21 % | 50 % | 39 % |
| Davos | North, south foehn | 350 | 15 % | 49 % | 33 % |
| Oberwallis (Visp) | Valais | 477 | 23 % | 55 % | 30 % |
| Mittelwallis (Sion) | Valais | 61 | 2 % | 21 % | 9 % |
| Unterwallis (Evionnaz) | Valais | 252 | 8 % | 71 % | 11 % |
| Chablais (Aigle) | Valais | 71 | 0.1 % | 40 % | 2 % |
| Leventina (Piotta) | South, north foehn | 827 | 21 % | 48 % | 21 % |
| Blenio (Acquarossa) | South, north foehn | 619 | 9 % | 73 % | 4 % |
| Maggiatal (Cevio) | South, north foehn | 393 | 5 % | 54 % | 2 % |
| Magadinoebene (Magadino) | South, north foehn | 355 | 4 % | 54 % | 1 % |
| Misox unten (Grono) | South, north foehn | 228 | 3 % | 36 % | 2 % |
| Misox oben (San Bernardino) | South, north foehn | 382 | 9 % | 13 % | 39 % |
What the table says
At 4 to 6 hPa, foehn on the valley floor is the exception. In none of the 20 valleys did foehn blow more than a quarter of the time in this class. In Altdorf it was 10 %, in Vaduz 6 %, in Glarus 1 %.
Even at 10 hPa and more, foehn is not certain. With differences that large, Bad Ragaz and Altdorf had foehn in around nine out of ten measurements. Andeer and Davos had it in only half, Altenrhein in less than a third.
In the inner Alps, foehn comes even without 4 hPa. In Andeer 39 % of all foehn hours fell in periods with less than 4 hPa, in Davos 33 %, in Visp 30 %. For Valais, the Lugano and Zürich axis is the wrong one anyway, because the foehn there blows from the southeast.
The spread between neighbouring valleys is huge. Bad Ragaz has eight times as much foehn as Altenrhein, Elm three times as much as Glarus, Visp eight times as much as Sion.
So the measurements confirm what instructors have been writing for years. The DHV (German Hang Gliding Association) gives three to four hectopascals as the usual rule of thumb. In the same article it describes a foehn day with barely more than two hectopascals [12]. Another DHV article warns against "home-made local limits" [13]. The SHV names areas such as Marbach in the canton of Lucerne, where pilots fly at well over 4 hPa without the foehn breaking through [11]. None of the MeteoSwiss pages we checked mentions a 4 hPa threshold.
That does not make the number worthless. From 4 hPa a foehn situation becomes possible, and from 8 hPa foehn is common in the large foehn valleys. But it does not tell you whether the foehn will reach the ground in your valley, and when.
And what did the forecast models show?
The models show the wind direction reliably, but the wind too weak. In the foehn event of 26 to 28 August 2026, ICON-CH1 and ICON-CH2 showed wind from the right direction at 13 valley stations in 92 to 96 % of the foehn hours. Their gusts were a median of almost 8 km/h below the measurements, and the air was around 8 percentage points too humid and almost 1.5 degrees too cool. If you require foehn direction, strong wind and dry air together, ICON-CH1 caught 69 and ICON-CH2 65 out of 100 foehn hours. The station's own measurements caught 90. If you read only direction and dry air, you catch 84 to 85 out of 100 foehn hours. The price: in almost every second hour flagged this way, the foehn did not reach the valley floor.
The models have no foehn index. They provide ordinary weather values: wind direction, mean wind, gusts, humidity and temperature. We retrieved these values from MeteoSwiss's ICON-CH1 (1 km grid spacing) and ICON-CH2 (2.1 km) hour by hour at the location of the 13 valley stations where foehn blew. Then we put them next to the same quantities measured by the station. Whether foehn actually blew is decided by the foehn index.
How well do the individual values match?
Median over the 213 measured foehn hours:
| Quantity | Measured | ICON-CH1 | ICON-CH2 |
|---|---|---|---|
| Wind from the valley's foehn direction | 97 % of hours | 92 % | 96 % |
| Mean wind | 24 km/h | 21 km/h | 18 km/h |
| Gust (strongest of the hour) | 51 km/h | 41 km/h | 39 km/h |
| Relative humidity | 38 % | 47 % | 48 % |
| Temperature | 28.0 °C | 26.3 °C | 26.1 °C |
The wind direction is almost always right. Both models showed wind from the right direction in 92 to 96 % of the foehn hours. The wind is too weak. Hour by hour, the model gusts were a median of almost 8 km/h below the measurements, and the mean wind 3 to 4 km/h. The air is too humid and too cool. The models showed it around 8 percentage points more humid and almost 1.5 degrees colder than measured.
Which feature gives foehn away in the forecast data?
Foehn on the valley floor leaves a pattern: wind from the foehn direction, strong and dry. We tested each feature on its own, first on the station's measurements, then on the model values. We chose the thresholds ourselves (mean wind from 20 km/h or gusts from 30 km/h, humidity at most 60 %).
Forecast
Which feature gives foehn away?
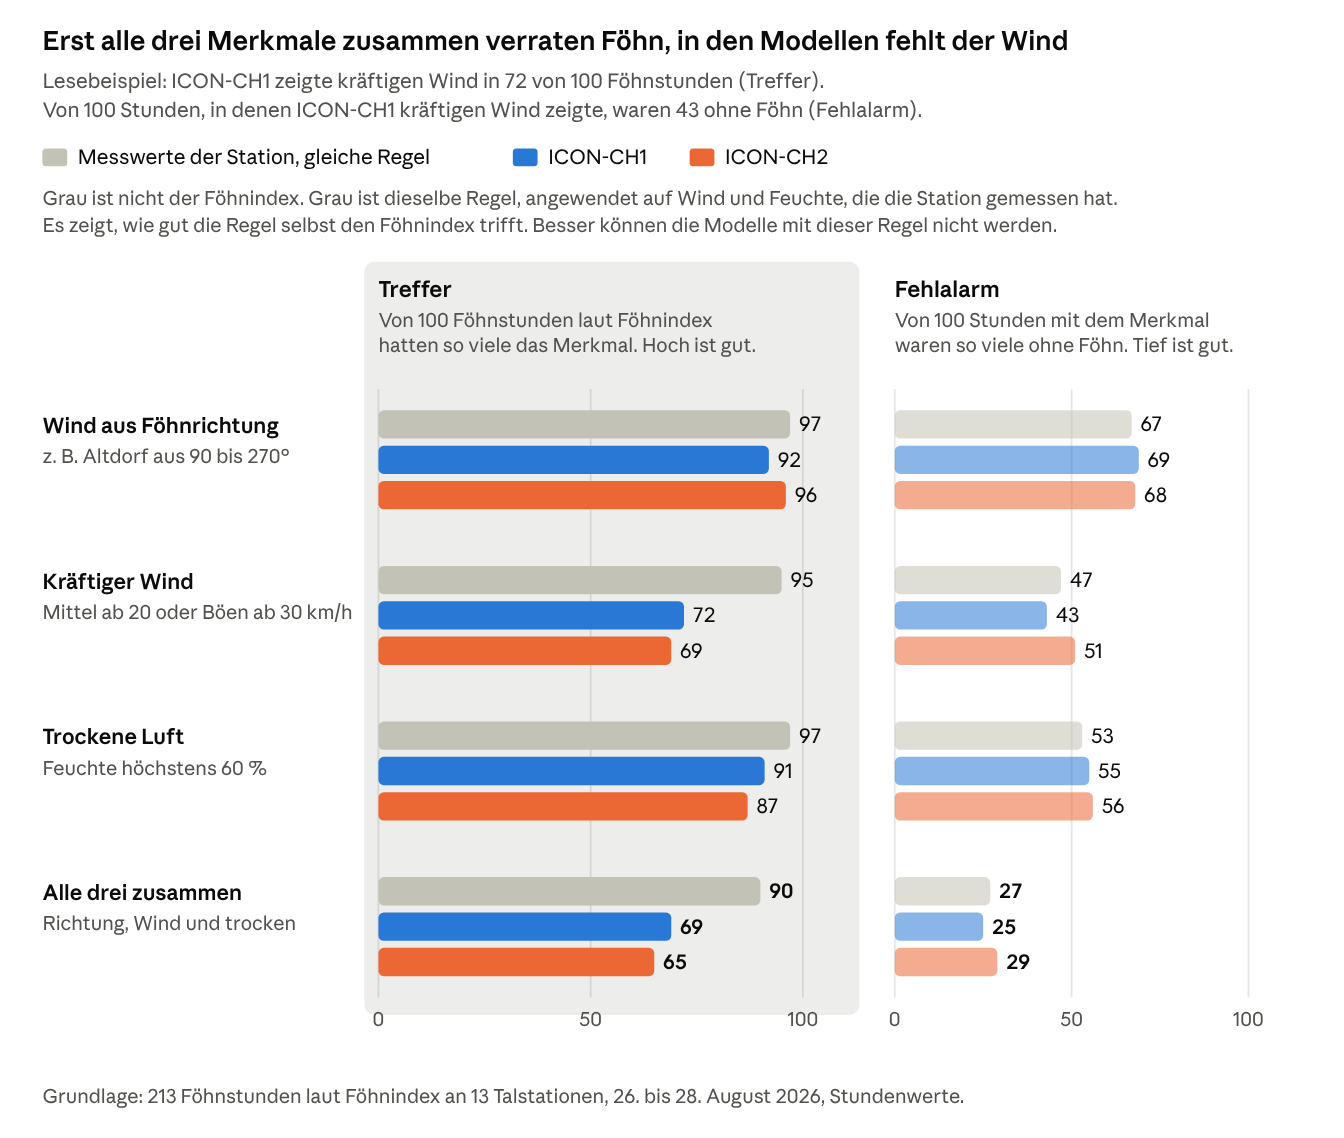
On its own, none of the features is any good. Wind from the foehn direction was there in almost every foehn hour, but of 100 hours with that direction, around 68 had no foehn. Together they work. In the station measurements the combination catches 90 out of 100 foehn hours, and only 27 out of 100 hours with all three features are false alarms. In the model values it is 69 hits for ICON-CH1 and 65 for ICON-CH2. Almost all of the loss comes from the wind: the models show the foehn from the right direction and mostly dry enough, but too weak.
Hour by hour, valley by valley
Forecast
Measurements versus ICON-CH1 and ICON-CH2
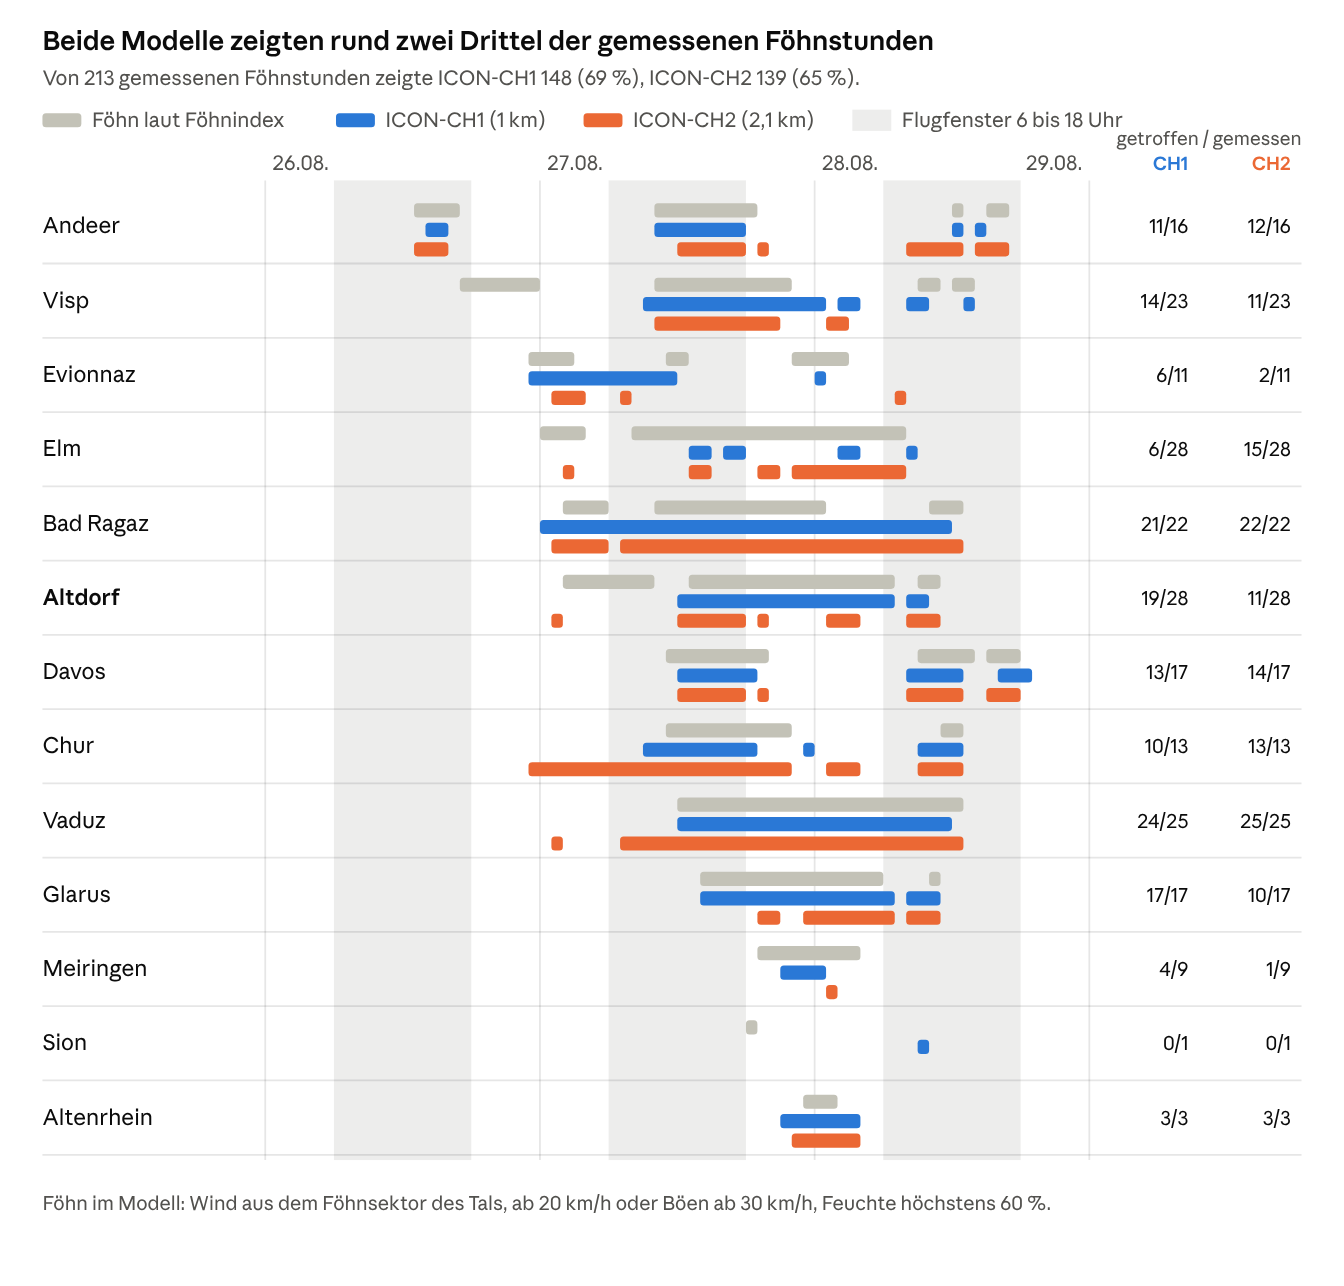
The chart shows all three features together. ICON-CH1 showed them in 148 of 213 measured foehn hours, ICON-CH2 in 139. In Vaduz ICON-CH1 caught 24 foehn hours and ICON-CH2 all 25. In Davos ICON-CH1 caught 13 and ICON-CH2 14 out of 17.
In Altdorf, on the morning of 27 August (02:00 to 10:00), neither model showed a single foehn hour. In Visp on the evening of 26 August (17:00 to 24:00) the foehn was also missing from both models, and in Elm in the night to the 27th only ICON-CH2 showed one hour. Of the 9 foehn hours in Meiringen, ICON-CH1 showed 4 and ICON-CH2 one.
The other way round, ICON-CH2 showed foehn in Chur from 23:00 on 26 August. The measured foehn only started there in the late morning of the 27th, so that is 17 hours too many. Both models showed foehn in Bad Ragaz in the night and on the morning of the 28th, and ICON-CH1 in Evionnaz on the morning of the 27th. In total there were 49 model hours for ICON-CH1 and 57 for ICON-CH2 without measured foehn.
Forecast
Altdorf: measurements versus both models
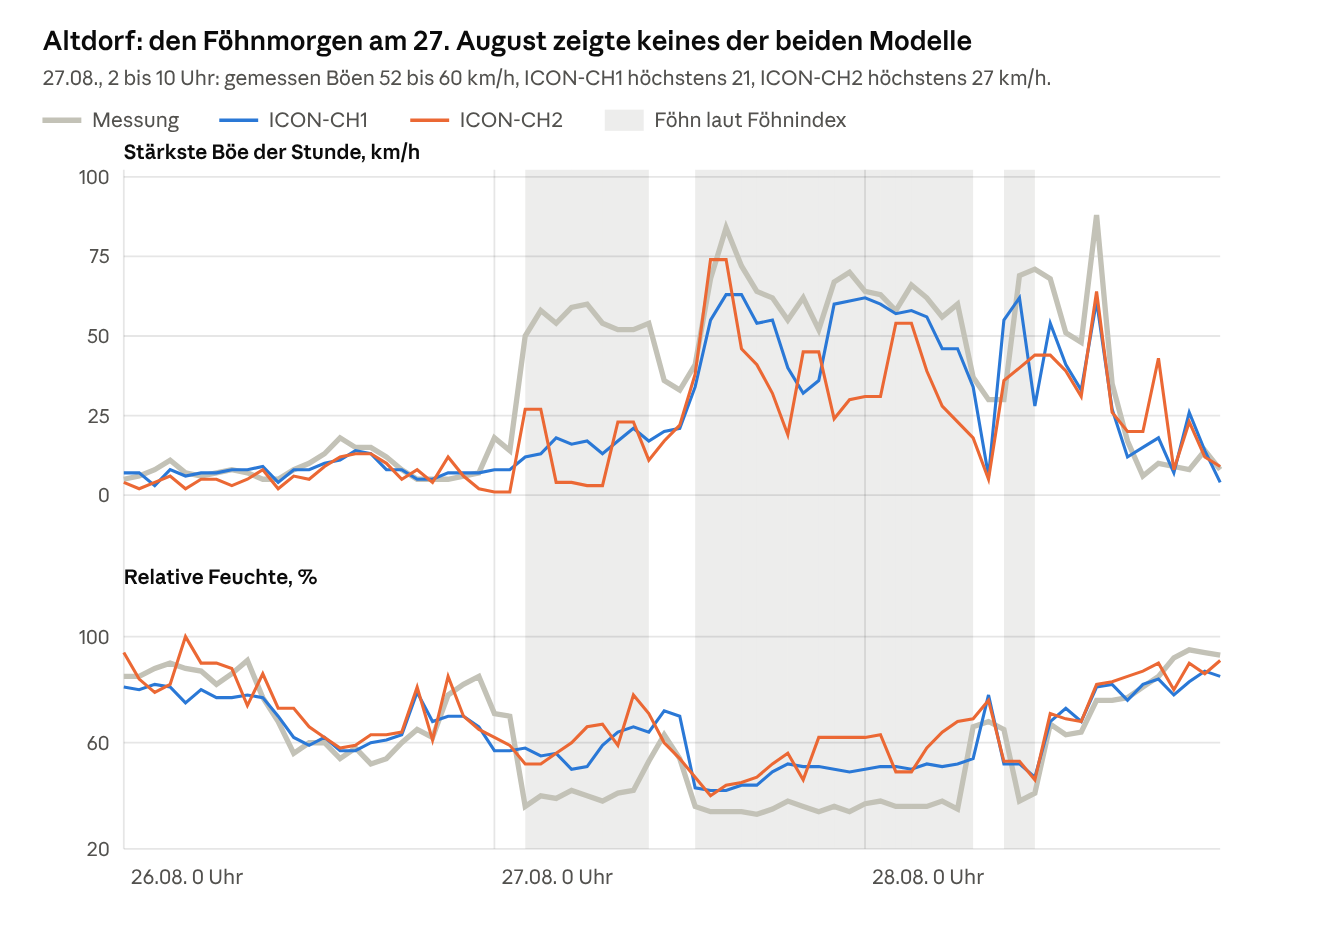
Altdorf shows it most clearly. During the foehn phase on the morning of 27 August, gusts of 52 to 60 km/h were measured at around 40 % humidity. ICON-CH1 showed at most 21 km/h, ICON-CH2 at most 27 km/h, both with 50 to 78 % humidity. From midday both were closer to the measurements: 84 km/h measured between 14:00 and 15:00, ICON-CH2 74 km/h, ICON-CH1 63 km/h.
During the foehn from midday on the 27th to the morning of the 28th, both models also showed the air in Altdorf as more humid than it was: 33 to 38 % measured, ICON-CH1 42 to 52 %, ICON-CH2 40 to 68 %. So if you search the forecast data for dry foehn air, you will find it less often than it actually blows.
So the models do show the foehn situation, but too weak and often at the wrong hour. When they missed foehn, in around half the cases they still showed south wind and dry air. Only the wind was too weak (ICON-CH1 34 of 65 missed hours, ICON-CH2 39 of 74).
What this means for your flight planning
The forecast reliably shows whether a foehn situation is coming. Whether and when the foehn will reach the ground in your valley, it shows only roughly. So use it to decide on which days you need to look closely. What actually happens on the day is shown by the measurements and by your own assessment on site.
1. The day before: is it a foehn situation?
- Pressure difference Lugano minus Zürich, the reverse for north foehn. From 4 hPa foehn is possible, from 8 hPa it is common in the large foehn valleys. In the inner Alps it also comes below 4 hPa.
- Wind at pass height, around 2000 m. For south foehn, the SHV advises checking whether a south wind is blowing there and whether the air on the south side is cooler [11]. A difference of 1 to 2 degrees is a warning sign [7]. For north foehn the same applies with a north wind and cooler air on the north side.
2. For your valley: read the forecast as a warning
- Wind from the foehn direction plus dry air is enough of a warning. If the forecast for your valley shows wind from the foehn direction and humidity below 60 %, expect foehn, even if the wind in the model is weak. In our case, reading it this way would have caught 84 to 85 out of 100 foehn hours. The price: in almost every second hour flagged this way, the foehn did not reach the valley floor.
- Model gusts are a lower limit. The median was almost 8 km/h below the measurements. On the morning of 27 August in Altdorf they were 29 to 57 km/h too low.
- The timing is uncertain. Plan to be on the ground before the earliest possible breakthrough, not before the most likely one.
- The forecast warns, it does not decide. Even read this way, 15 to 16 out of 100 foehn hours came without a warning. So no warning does not mean no foehn. Whether you can fly is your decision on site, at the launch site and with the current measurements.
3. On the day: watch the measurements
- The onset is visible. When the foehn reaches the valley, the gusts jump, the wind turns to the foehn direction and the humidity drops. In Altdorf on 27 August the gusts rose from 14 to 50 km/h within one hour. In Glarus they rose from 8 to 39 km/h, and the humidity there fell from 62 to 36 %.
- Compare valley and summit. Calm wind in the valley and strong wind from the foehn direction on the summit often means "foehn above the cold-air pool". On 26 August, 45 to 64 km/h were already blowing on Gütsch while Altdorf was still calm.
- Look at the neighbouring valleys. Valleys that get the foehn earlier are your early warning. In this case it was Andeer and Visp, half a day before Altdorf.
- Sheltered from foehn does not mean foehn-free. A launch site in the wind shadow can be calm while the foehn runs over the top.
Limitations of this analysis
- The valley floor is not the launch site. The foehn index applies at the station, between 203 and 1639 m. Foehn above a cold-air pool counts as "no foehn" there, but can be blowing at launch height.
- One pressure pair for all valleys. We used Lugano minus Zürich everywhere. For Valais and for inner-Alpine valleys a different axis would fit better.
- All hours, index 2 only. The statistics include day and night. Mixed foehn air (index 1) is not counted, which underestimates the foehn time in Chur and Sion.
- The north foehn criteria are not published. The method is documented for south foehn [10].
- The model values were retrieved after the fact. The Open-Meteo archive strings together the most recent runs of ICON-CH1 and ICON-CH2, so the lead time is shorter than for a forecast made the day before. A real forecast would probably do worse. We defined the foehn features in the model ourselves. With other thresholds the percentages would come out differently.
- One case is not a climatology. The comparison with the models rests on a single south foehn situation, 26 to 28 August 2026.
- We did not measure turbulence. The stations measure wind at the ground. They tell you nothing about rotors and wind shear in the free air.
Frequently asked questions
At how many hPa does foehn start? There is no fixed threshold. In Altdorf, at 4 to 6 hPa foehn reached the valley floor only 10 % of the time, and from 10 hPa 88 % of the time. In Andeer, Davos and Visp, around a third of all foehn hours occurred with less than 4 hPa.
Why is foehn dangerous for paraglider pilots? Because it is strong and turbulent, and you often cannot feel it at the launch site. On the lee side, waves and rotors form down to near the ground, the wind shears at the boundary with the cold-air pool, and when the foehn breaks through it quickly turns stormy.
How do I recognise foehn without a foehn wall? By the air and by the measurements. Foehn air is warm and very dry. Signs are strong wind from the foehn direction at summit stations while the valley is calm, cooler air on the windward side at pass height, and foehn in the well-known foehn valleys: for south foehn in Altdorf or Vaduz, for example, for north foehn in the Leventina.
Does foehn need rain on the windward side? No. During the south foehn of 26 and 27 August 2026, ten stations on the south side recorded practically no rain, and Altdorf still had 29.5 °C at four in the morning.
What is the difference between south foehn and north foehn? South foehn blows on the north side of the Alps when the flow comes from the south. North foehn blows on the south side of the Alps when the flow comes from the north.
Can a weather forecast predict foehn in the valley? Partly. The models have no foehn index, but they do have wind direction, wind and humidity. Reading all three together, ICON-CH1 showed 69 % and ICON-CH2 65 % of the measured foehn hours. The direction was almost always right, but the wind in the model was too weak.
Sources and data
- [1] MeteoSwiss, Wetter und Klima von A bis Z: Föhn (in German)
- [2] Steinacker, R. (2006): Alpiner Föhn, eine neue Strophe zu einem alten Lied. promet 32 (1/2), 3–10, DWD (in German)
- [3] Deutscher Wetterdienst (German weather service), aviation: Wetterabhängige Gefahren im Bereich von Gebirgen (in German)
- [4] Würsch, M., Sprenger, M. (2015): Swiss and Austrian foehn revisited: A Lagrangian-based analysis. Meteorologische Zeitschrift 24 (3), 225–242
- [5] Jansing, L. et al. (2022): Classification of Alpine south foehn based on 5 years of kilometre-scale analysis data. Weather and Climate Dynamics 3, 1113–1138
- [6] Deutscher Wetterdienst, Wetterlexikon: Föhn (in German)
- [7] SHV, Entscheidungsstrategie Meteo V10 (in German)
- [8] Gutermann, T. et al. (2012): Föhnklimatologie Altdorf: die lange Reihe (1864–2008). MeteoSwiss technical report 241 (in German)
- [9] MeteoSwiss, Wetter und Klima von A bis Z: Föhnindex (in German)
- [10] Dürr, B. (2008): Automatisiertes Verfahren zur Bestimmung von Föhn in Alpentälern. MeteoSwiss working report 223 (in German)
- [11] Oechslin, R., Stocker, B.: Schwer erkennbare Föhnlagen. Swiss Glider 03/04 2025, SHV (in German)
- [12] Haas, L.: Misstraut den Föhndiagrammen. DHV-Magazin 240 (2023) (in German)
- [13] Schwanitz, V.: Föhn ist nicht gleich Föhn. DHV-Magazin 204 (2017) (in German)
Measurements: MeteoSwiss Open Government Data, SwissMetNet, ten-minute values (foehn index, gusts, wind, temperature, humidity, precipitation, air pressure). Case study 26 to 29 August 2026 at 34 stations, statistics 2020 to 2025 at 20 valley stations plus Lugano and Zürich-Fluntern (documentation).
Forecast: ICON-CH1 and ICON-CH2 (MeteoSwiss) via the Open-Meteo Historical Forecast API, hourly values at 14 valley stations, 13 of which had foehn, 26 to 28 August 2026. The raw data and the calculation script are in the marketing repo under 2-ausfuehrung/wetterkunde/belege/foehn/.
How Wingcast handles this
Wingcast reads the weather models every morning for the Swiss launch sites and describes in plain language what they mean for your launch site. With foehn, that means we do not only look at the pressure difference in the model data. We look at wind, direction and humidity in the foehn valleys themselves. This analysis shows how far you can trust that data. Wingcast is decision support: we provide data and an assessment, you make the decision.
→ What a gust front looks like when measured, and what the model said about it → Dust devils: how to spot a dusty day → Flying weather Switzerland today: situation, warnings and thermals for the next three days → All meteorology topics → Open Wingcast for free and check your spot