Dust devils in paragliding: how to spot a dusty day
WingcastUpdated 2026-09-1838 min read
TL;DR — A dust devil — Staubteufel in German — is a rotating vortex driven purely by thermal heating, 10 to 100 m wide, and in Central Europe it usually lives less than a minute [2]. It is dangerous because one side of your wing gets a tailwind while the other simultaneously gets a headwind — in an idealised model calculation, roughly 69 km/h of difference across a 10 m span. And in Switzerland the dust that would make it visible is usually missing — at the Schwyberg FR in 2025, an invisible vortex lifted a pilot off a grassy launch site. No forecast sees the individual vortex. What can be calculated is the stage before it: whether today is a dusty day, where, and at what hour. We calculated this for 490 Swiss launch sites over 69 summer days and checked it against 74 measuring stations: low, dry locations, peak around 13:00, Valais in front — and in our data, the rule of thumb used at the launch site describes Switzerland better than the criterion from the scientific literature.
Every textbook contains the same paragraph on dust devils: hot ground, rising air, angular momentum, done. What is missing are numbers for Switzerland.
The topic is more current than it has been in a long time: the SHV/FSVL made it the cover story of the July/August 2026 issue of Swiss Glider — with the account of a severely injured pilot [12] and a meteorology piece by Roger Oechslin, the federation's meteorology officer [11]. Added to that are two texts from the DHV [1] [2] and one from Lucian Haas [10]. All of them name the ingredients, and all of them name them correctly — but nobody has worked out how often they come together in Switzerland, where, and at which hour. That is exactly what this article does. It contradicts the SHV/FSVL nowhere; it puts numbers on it.
A note on language: in German the vortex is called Staubteufel, in Switzerland also Heuteufel, and in meteorology a Kleintrombe (small whirlwind). At the launch site everyone says dust devil or dusty anyway — and that is what we call it here too.
What a dust devil is
The German weather service (DWD) lists it as a "small, narrowly bounded whirlwind" that arises "mostly in summer through the sudden rise of a hot bubble of air that was heated at the ground" [3].
A dust devil is not a tornado. The difference is not the size but the drive: a tornado hangs from a thunderstorm cloud and reaches continuously up to cloud base; a dust devil has no connection to a cloud and is driven solely by the overheated ground [4]. That is why it also forms under a cloudless sky — blue thermals are in fact its favourite weather.
Two things matter more to you than the definition. The direction of rotation is random: at this size the Earth's rotation plays no role, the spin comes from the random inflow [3] — which incidentally settles the belief in "mostly left-turning thermals" [2]. And the dust is not the vortex, it only makes it visible. Over grass, rock or damp ground the same vortex keeps turning, invisibly; the dust acts, as Lucian Haas puts it, "like an amplifier" [10].
And in Switzerland? Most of the time you don't see it
This is the point where Switzerland differs from the pictures from Morocco and Arizona — and it appears in hardly any textbook. The ground has to supply the dust first. Swiss launch sites and landing fields are grassland, alpine pasture, forest or rock; there is hardly any loose material lying around. The vortex forms anyway — it simply doesn't show itself.
⚠️ Schwyberg FR, 2 July 2025, 13:00. A pilot with 45 years of flying experience is standing at launch at 1600 m, clipped in, brake handles not yet in his hands. The site: grassy, no jagged rocks, familiar for decades. Weeks without rain, hot, no wind, stable stratification. The vortex comes from behind and invisible, lifts him to 25 to 30 m — the flight instrument records 5 m/s of climb and 60 km/h — and leaves him severely injured in the lee. His own words on it: "Dust devils were not part of my mental model" [12].
Here, a vortex becomes visible almost only where loose material lies: on harvested fields, over gravel, building sites and sand pitches — the best-documented Swiss case travelled for minutes across the sand pitch in the village centre of Schüpfheim LU in 2012 [9] —, over scree and snow-free ski slopes, and generally in Valais.
Two things follow from this. "I've never seen one here" is not an argument — it says something about the surface, not about the vortices. The DHV notes for the Alps: "In the Dolomites in particular there have already been increasing numbers of dangerous situations caused by invisible or barely visible dust devils" [2]. And sighting reports are no good as statistics, because what gets reported is what gets seen. That is why further down we calculate with conditions instead of sightings.
How it forms
In Central Europe a dust devil usually forms out of a vigorous thermal release — often in blue thermals — over an overheated, open surface [2] — simplified into five steps:
- The ground overheats. Directly above the surface sits a thin, very hot layer of air. It wants to go up, it just can't break away.
- The bubble releases. As soon as the overheated air tears itself loose, it rises as a bubble.
- A local low forms underneath. Where the warm air was a moment ago, it is now missing at the ground: a low pressure remains there. All around, the air is at higher pressure — and air always flows from higher to lower pressure. So it streams into this hole from every side.
- The inflow is uneven, and out of that comes rotation. A slope, a hedge, a slight tailwind component is enough. The air does not run into the hole in a straight line but past it, and starts to circle.
- The vortex is stretched and thereby becomes fast. The thermal pulls the rotating tube out lengthwise, its cross-section thins — and the rotation accelerates enormously, the same effect as a figure skater pulling in her arms.
Now the vortex can sustain itself for a while: the fast rotation creates an even lower pressure in the core, which sucks in more air. It is exactly this core pressure that determines the wind speed in a moment. And it ends when the supply is cut off — because cooler air gets into its foot, because it moves over damper ground, or because a gust shears it off [11]. That is why it usually lives less than a minute here. You cannot rely on that, though: where one has formed, the next one forms.
Formation
From overheated ground to a rotating tube
Three things distinguish it from a normal thermal. There too, air leaves the ground and air flows in behind it, but the rotation concentrates the same energy onto a tenth of the area. The transition is an edge rather than a gentle rise — within a few metres the wind direction flips through 180 degrees. And it stays at the ground and travels, straight across the launch site if you are unlucky. A ground phenomenon, not a phenomenon of altitude. At slope launch sites there is the added fact that the initial push into rotation often comes from a slight lee — together with the supply of warm air from a south-facing slope, an ideal breeding ground [2].
Why a small vortex collapses your wing
Imagine the vortex standing in front of you with your wing across it. The air then runs one way on the left side of your wing and the other way on the right: one half of the canopy gets a tailwind, the other simultaneously a headwind — across the 10 metres of your span. Your wing does not measure wind strength, it measures the difference between its two ends — and it fits entirely inside the vortex.
How large that difference can become is shown by an idealised model calculation: a core pressure drop of 2 hectopascals — simulations show vortices with "pressure drops of hundreds of pascals" [6] — gives around 34 km/h on each side, so roughly 69 km/h of difference across the span. That is an order of magnitude, not a load figure: what actually reaches the wing additionally depends on radius, position in the vortex, shear and duration. The DHV confirms the consequence: at low height a turbulence often arises that is "so strong that the paraglider collapses massively" [1].
The collapse mechanism
Not the wind strength — the difference across the span
To recalculate: v = √(Δp / 2ρ) with ρ = 1.10 kg/m³, from the balance between pressure gradient and centrifugal force at the edge of the core — derivation in Jackson [7] after Rennó et al.; it idealises heavily. On size: in Central Europe a dust devil usually lives less than a minute and rarely stays higher than 100 m, in deserts up to half an hour [2].
Is today a dusty day?
Whether today is a dusty day is decided by the weather — plenty of sun, dry ground, dry air and light wind without a clear direction, according to the DHV's pilot rule [1] — and by a strongly overheated surface layer [5]. For the wind we calculate with the documented upper limit: above roughly 25 km/h, hardly any dust devils form [5]. The remaining numerical thresholds are our choice for the calculation; the DHV names none (see Limitations). In our analysis (weather model via Open-Meteo) for 490 Swiss launch sites over 69 summer days in 2026, these conditions came together most frequently in low, dry locations: below 800 m in around 20 % of the daytime hours, above 1600 m in around 2 %, most markedly in the Rhône valley. The critical time is 12:00 to 16:00 with the peak around 13:00 — measured at 74 SwissMetNet stations [8], the surface layer at that hour was steeper than 4 kelvin per metre in 37.6 % of the hours.
Three sub-questions, three answers from our data: whether the day offers the conditions at all, when they come together most densely, and where.
Does the weather fit?
For a dust devil to be able to form at all, five conditions must be met simultaneously according to the DHV — we call them the pilot rule here [1]. Four of them come out of any weather model; those can be recalculated for every day and every launch site:
- Plenty of sun, few clouds (global radiation from 700 W/m²) — the engine.
- Dry ground (below 0.10 m³/m³) — wet ground evaporates instead of heating up, and supplies no dust either.
- Dry air (relative humidity below 40 %) — typical of blue thermals.
- Light wind (below 7 m/s = 25 km/h) or no clear wind direction at the ground.
The numbers in brackets are our calculation thresholds, not the DHV's — it names none. Only the wind limit is a documented value from the literature [5] (see Limitations).
The fifth condition could not be calculated: the air has to get colder with height quickly, by more than 0.7 °C per 100 m — the unstable stratification that every thermal pilot knows. For most of the 69 days we lack the upper-air data (see Limitations). All the figures for the pilot rule in this article therefore rest on four out of five conditions and come out too high rather than too low.
So much for the pilot rule — the rule of thumb the DHV hands pilots for use at the launch site. But there is a second answer to the same question, and it comes from science [5]. This research criterion does not look at sun, dryness and wind at all. It hangs on a single quantity: how fast the temperature drops in the lowest two metres above the ground — in the surface layer. Further down we let the two lists compete against each other; until then it is about this one number.
It is easy to confuse with the DHV point just mentioned, because both refer to a temperature gradient. The difference is the thickness of the layer: the 0.7 °C per 100 m describe hundreds of metres of atmosphere, the research criterion the lowest two metres — there the gradient is around 1200 times steeper, which is why it is calculated in kelvin per metre instead of degrees per 100 metres. And this surface layer is the only quantity in the whole story that can be measured rather than estimated in Switzerland. That is why we keep coming back to it.
We call this layer steep from 4 kelvin per metre, which means 8 degrees of difference between the ground surface and the air at 2 m height — say ground 36 °C, air 28 °C. The threshold is not ours: the global study tests three values, 4, 8.5 and 10 K/m [5] — the 4 K/m from general observations over land (Oke 2007, after Ryan 1972), the 8.5 and 10 K/m from desert measurements of the SAMUM campaign in southern Morocco in 2009 (Ansmann et al.).
We therefore calculate everything with both thresholds. The study itself considers 8.5 K/m its best estimate, because steeper gradients fit the observations better globally; in Switzerland, however, 8.5 K/m is reached even in the measurements in only 0.2 % of the hours, while 4 K/m is reached in 26 %. Anyone calculating here with the desert value alone almost always gets a zero — and a zero is not a finding but possibly an artefact.
A threshold is not a switch. Above 4 K/m a vortex does not suddenly appear; the surface layer is then merely steep enough that one could form, provided the other conditions come together and something gives it the twist. A threshold above which a dust devil reliably occurs in Central Europe is not known to us from any measurement series.
That leaves the wind, and there the matter is less simple than it sounds. Towards the top, the literature names a clear limit: above roughly 7 m/s, that is 25 km/h, hardly any dust devils are observed [5]. The vortex is then sheared off faster than it can build up. But dead calm is not the safest state, because the initial rotation has to come from somewhere, and that is typically supplied by exactly a gust or a lee situation. What is dangerous is therefore not a lot or a little wind, but light wind without a clear direction.
When during the day?
The most critical time is the one in which the ground has done the most groundwork and the thermals first break through fully. In our measurement data from 74 stations the peak lies clearly at 13:00 local time: at that hour the surface layer is steeper than the 4 K/m just explained in 37.6 % of the measured hours. The critical window is roughly 12:00 to 16:00; at 18:00 it is still 6 %, after which it is practically quiet.
Diurnal cycle · 74 stations · summer 2026
The peak lies at 13:00
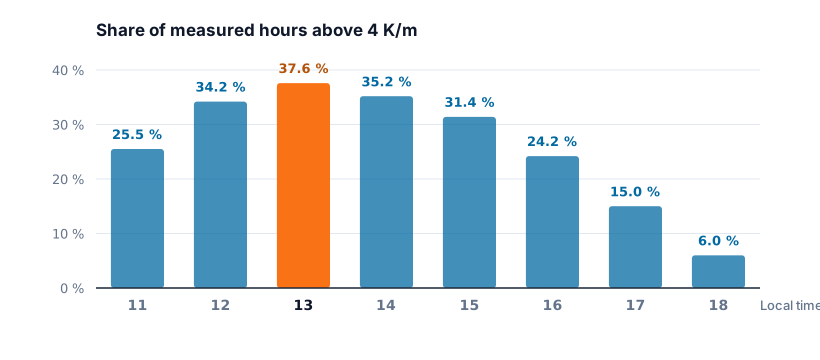
Three independent confirmations: the global study on the subject found its peak between 12:00 and 13:00 [5], the DHV names the "late morning to early afternoon hours, when the inversion has been heated away" [1], and the SHV/FSVL recommends heightened attention from 11:00 to 16:00, with a season from June to September [11]. The accident at the Schwyberg happened at 13:00.
Where?
On the large scale, our figures point downwards and towards the dry. The share of hours with the conditions met falls from around 20 % below 800 m to around 2 % above 1600 m. Among the measuring stations, Sion in the Rhône valley stands out: there the surface layer is on average more than twice as steep as elsewhere, and nine of the twelve strongest individual hours of the summer come from this one station.
In the terrain itself our calculation then stops, because a model cell of 1 km knows neither forest edges nor knolls. The pilot has to bring these features along; the SHV/FSVL names four [11]: dry surfaces with little vegetation (arable fields, closely mown meadows, slope surfaces above the treeline), wind-sheltered areas in which the air can heat up undisturbed, lee areas behind forest edges or buildings, where local eddies act as suppliers of angular momentum, and open, homogeneous topography with knolls, where neither slope lift nor valley wind sets the direction. The Schwyberg carries exactly this signature: flat ridge, open terrain, dry brown alpine pastures, no clear wind.
What the figures do not tell you is everything that counts once you are already standing on the slope: whether the vortex is running towards you right now, how it turns, how big it is. The data say keep your eyes open today — the rest only you can see.
Pilot rule versus research
Both answer the same question: is today dust devil weather? If both are right, they must fire on the same hours. That is exactly what we recalculated — and the result surprised us.
Calculated for 490 launch sites over 69 summer days (28 May to 4 August 2026), every hour from 11:00 to 18:00. That gives 270,480 launch-site hours: one place at one particular hour. For each of them we asked whether all conditions were met simultaneously. The percentages below say for how many of these hours that was the case. They do not say how often a vortex actually formed — we are counting opportunities, not events.
"All conditions" means something different depending on the list — the two do not check the same quantities:
| List A · pilot rule [1] | List B · research [5] | |
|---|---|---|
| Radiation | ≥ 700 W/m² | — |
| Soil moisture | ≤ 0.10 m³/m³ | — |
| rel. humidity | ≤ 40 % | — |
| Wind | ≤ 7 m/s [5] | — |
| Surface layer (0–2 m) | — | > 4 or 8.5 K/m |
| Buoyancy versus friction | — | w*/u* > 5.0 |
So the pilot rule asks about the state of the landscape — sun, dryness, calm. The research criterion asks about the physics of the lowest two metres: how steep the surface layer is, and whether thermal buoyancy dominates friction (that is w*/u* — roughly: "how vigorously the thermals stir from below" divided by "how strongly the ground brakes"). Both lists claim to describe the same weather. Whether that holds is the question of this chapter.
How hot the ground has to be for that
8.5 kelvin per metre sounds like a typo. Calculated over 2 metres it means: 17 degrees of difference between the ground surface and the air at knee height.
The decisive point: it is not the air that is cold — the ground is hot. What is meant is the temperature of the surface itself, not of the air just above it. Dry, dark earth, rock or gravel in full sun reach 45 to 60 °C, while the air at 2 m height sits at a pleasant 28 °C. Everyone knows this barefoot on a gravel path: the ground burns your feet, the air around you is merely summery warm. It is exactly this jump that is the fuel — it is the reason why the air near the ground wants to go up so urgently in the first place. A worked example over sunlit high-alpine rock: Zermatt-Oberrothorn, 3400 m, 24 June, 14:00 — air 13.9 °C, surface 34.9 °C, giving 21 degrees over 2 metres = 10.5 K/m.
What comes out of it
You would have expected both lists to mark the same hours, just in a different language. The opposite is the case. Of 100 hours that the pilot rule marks as critical, only 10 also meet the research criterion; of all the hours that at least one of the lists marks, only 5.7 % are marked by both. With the strict threshold of 8.5 K/m, list B practically never fires.
The contradiction is not noise either, but systematic by altitude: the pilot rule fires below 800 m in 20.26 % of the hours and above 2500 m in only 2.42 % — the research criterion the other way round, in 0.12 % low down and 13.43 % high up.
490 launch sites · 69 summer days · 270,480 launch-site hours
Pilot rule and research criterion — opposed by altitude
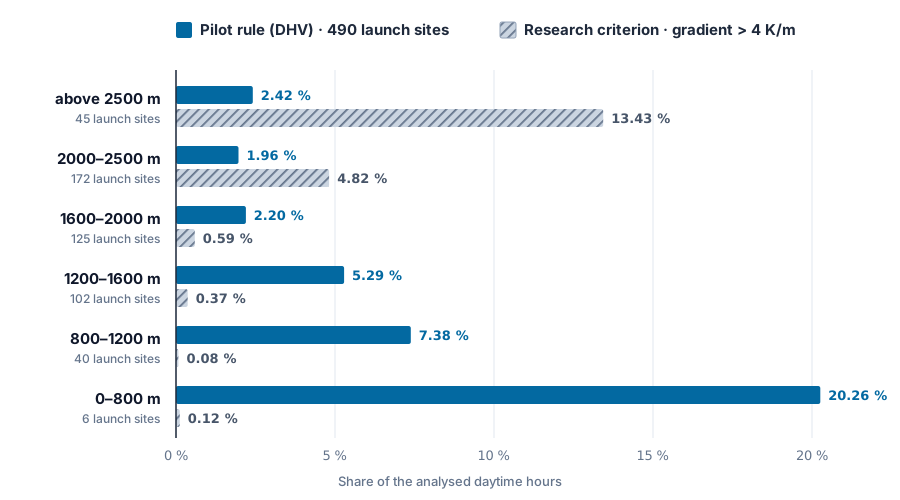
2026_sommer_staubteufel_bedingungen.csv.That the pilot rule fires so much more often low down is because its conditions come together more easily in the lowlands and in the valley regions: down there the air is warmer and therefore relatively drier, and so are the soils — arable land, harvested fields, the Rhône valley. Higher up the ground stays damp for longer, the alpine pasture is green, the air cooler and the wind on average stronger. Only one condition reverses: over sunlit rock the surface becomes extremely hot while the air above it stays cool — the good 10 K/m from the example above. And that is exactly the one the research criterion checks. Hence the opposing trend. Except: up there the dry, loose surface layer that feeds the vortex is missing — along with the dust that would show it. That is exactly what the pilot rule checks via soil moisture; the research criterion lacks this condition, because it was developed for deserts.
On top of that, one of the two B conditions is almost always met: w*/u* > 5 applies in 71.9 % of all summer daytime hours and is therefore almost worthless as a distinguishing feature. That matches the source itself, which notes that this criterion must not be used on its own [5].
Careful with the figure of 20.26 %. The lowest band consists of six launch sites, and they are anything but in agreement: Bogiàn 29.3 %, Oberrieden 27.2 % — but Kerenzerberg only 0.4 %. Altitude decides nothing, it only shifts the probability. What is robust is the direction, not the decimal place.
Does the model agree with the measurements?
Now we check whether the weather model arrives at the same result as the measuring stations. The reason: all the figures on the surface layer so far come from the model — the research criterion too calculates with a model value. Whether that value is right can be checked directly in Switzerland, because SwissMetNet measures air temperature hourly at many stations at 5 cm and at 2 m height [8]. The global study did not have that available: it had to derive the gradient from a model surface temperature, a finer vertical resolution being "not possible using ECMWF data" [5]. If model and measurement diverge, that incidentally decides which of the two answers can be trusted.
The obvious comparison would be to set the 490 launch sites against the stations. It would be worthless, because stations lie low and launch sites lie high — you would mostly be measuring the difference in altitude. We therefore fetched the model data at the station coordinates and set it hour by hour against the measurement from the same station: 74 stations, 40,711 paired hours, same place, same hour.
| paired comparison | median | p90 | maximum |
|---|---|---|---|
| measured (5 cm → 2 m) | 2.92 | 5.18 | 9.95 |
| model (surface → 2 m) | 1.00 | 2.65 | 6.25 |
The model lies below the measurement in 86.5 % of the paired hours (95 % interval after Wilson: 86.2 to 86.8 %), and the correlation is only r = 0.42. At the same locations the measured values exceed the 4 K/m threshold in 26.13 % of the hours, the model in only 1.85 %.
74 stations · 40,711 paired hours · same place, same hour
Almost every station measures more than the model calculates
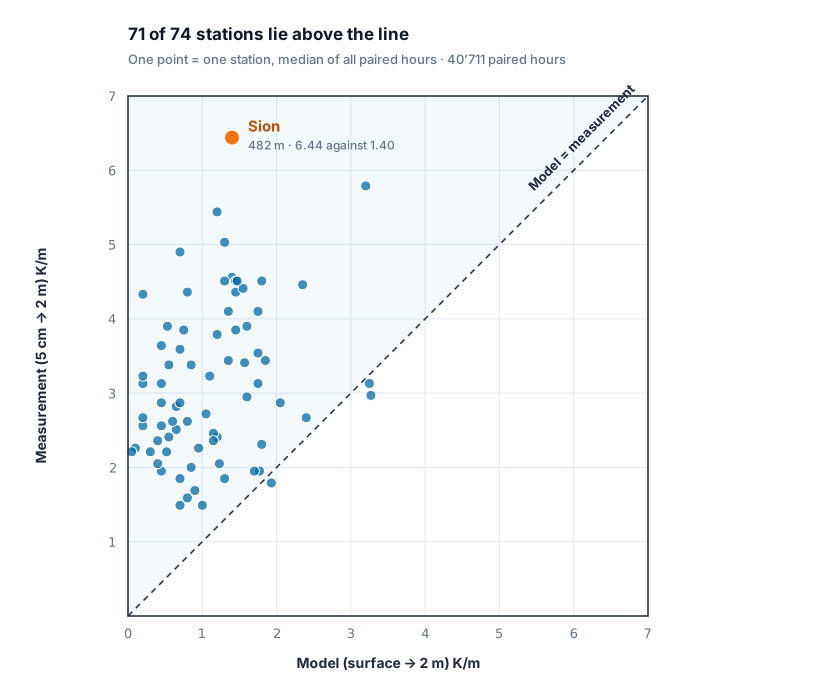
This is not an artefact of definition. The model calculates from the surface up to 2 m, the measurement only from 5 cm — the steepest part sits right at the bottom, the model includes it, the measurement does not. The difference should therefore make the model value larger, not smaller. We found the opposite, so the finding is rather conservative. The plausible reason, not proven by us: the surface temperature of a 1 km cell is an area mean over forest, meadow, rock and settlement, while the 5 cm sensor sits above one specific, short-grass surface.
The error does not depend on altitude — in all four station bands between 0 and 2500 m the model underestimates by 1.5 to 2.3 K/m. But it is not a uniform offset: in Sion the station measures a median of 6.44 K/m, the model sees 1.40; in Zurich/Affoltern, Geneva and Lucerne the two agree almost exactly. So the error occurs precisely where it gets interesting — at the dry, strongly irradiated locations. In Switzerland, the criterion from the desert literature therefore rests on a model quantity that is too low at exactly the relevant places.
How robust is this finding?
The altitude contradiction could also be a regional effect: low launch sites lie on the Plateau, in Ticino, in Valais and in the Jura, high ones in the inner-alpine region. We therefore asked the question again within each region that has launch sites below 1500 m and above 2000 m. Nine meet that, and in 9 out of 9 the pilot rule falls with altitude, while the research criterion rises in 7 out of 9. The pattern holds when you keep the geography constant.
And the choice of parameters itself? We recalculated the analysis with varied parameters. For wind, the pilot rule calculates with the documented upper limit of 7 m/s [5]; with a stricter 5 m/s variant, practically nothing changes in the altitude trend. And if you give the research criterion back the condition that was taken for granted in the desert — dry ground — its rise with altitude collapses by a factor of five in the topmost band: from 13.4 to 2.6 % of the hours. So the contradiction between the two lists does not hang on a wrongly set threshold, but for the most part on exactly the ground ingredient that the research criterion lacks.
Two more things need to be disclosed. Four launch sites are excluded, because the model grid places them more than 200 m wrong (one sat at 514 m instead of 1700 m) — 490 of 494 are analysed. And the absolute value of criterion B is uncertain: it hangs on an estimated quantity and varies by almost a factor of 3 depending on terrain roughness; the direction and the altitude contradiction survive across all variants, and the measured values do not depend on this assumption at all.
What you do at the launch site
This part does not come from us but from the associations: from the DHV's "Dust Devil Info" [1] and from the meteorology article in Swiss Glider [11].
Before take-off
Do not wait clipped in — as soon as the wing is sorted, the brake handles belong in your hands. At the Schwyberg exactly this move was missing. On hot, light-wind days between 11:00 and 16:00, scan the surroundings continuously, not just the windsock. And talk: reports from other pilots from the previous day or from the neighbouring region are a signal to be taken seriously.
Signs before you see it
Especially important here, where the dust is usually missing:
- The wind speed becomes irregular; unexpected gusts from the side or behind
- A bright rushing sound in the trees, a hissing noise from friction at the ground; bushes and trees get positively "shaken"
- Grass spirals on the ground and things in the air that do not belong there: grass, leaves, stuff sacks
- "Shimmering" air above dry surfaces — the sign of the overheated surface layer
- Pilots near the ground fly into the strongest climb or are turned sideways without doing anything themselves
- If one has already been sighted today, more will very probably follow
When one arrives
It is usually safer not to unclip, but to throw yourself onto the wing immediately, gather up the leading edge and cover it with your body — whether the wing takes damage is irrelevant at that moment. Never gather the wing into a "tulip" by the lines: if the vortex catches it, you will be dragged along. As a helper, shout loudly at once ("Dusty! from the left / right / behind") and lend a hand, but do not grab the lines. And never try to pull an empty wing out of the air — two cases are known in which pilots held the wing by the risers, were lifted into the air and fell to their deaths [1].
In flight and on landing
Considerably more clearance from the slope, fly around visible vortices with a wide margin — "they can dodge like a hare, a clear direction of travel is often absent". And: "If you see a dusty on your planned landing field, it is no longer your landing field." Look for an alternative landing field, even a considerably worse one. After landing, unclip immediately — the danger comes from the ground [1].
Conclusion: what you take away as a pilot
Everything that follows rests on one summer: 490 launch sites, 69 days, plus 74 measuring stations. These are not statements about dust devils in general, but what can be derived from this data for Swiss conditions.
- The map tips downwards, not upwards. Calculated over 490 launch sites, below 800 m around 20 % of the daytime hours met all the conditions, above 1600 m around 2 %. The place where you have to reckon with it is the landing field on the valley floor and the harvested field — not the ridge that looks like a desert.
- The evening flight is a different day from the midday flight. Measured at 74 stations, the share of steep surface layers is 37.6 % at 13:00, 15.0 % at 17:00 and 6.0 % at 18:00. Between 13:00 and 17:00 the opportunity therefore falls to less than half, and by 18:00 to a sixth — without you having to give anything up. Anyone who can choose their time window holds the biggest lever there is.
- The real warning sign is the dry ground, not the sun. Of the four conditions of the pilot rule, light wind was met in 98 % of all daytime hours and strong radiation in 46 % — dry ground in only 13 %. Sun and calm you get on almost every fine-weather day; what makes the dusty day is the weeks without rain beforehand.
- In Valais it is worse than any forecast shows. In the paired comparison the model calculated the surface layer too flat in 86.5 % of the hours, in Sion by a factor of 4.6. Precisely where it is dry and strongly irradiated, the model figure is too harmless — in such regions rely on what you see, not on a value from the app.
- The missing dust is not an all-clear. Our measured values show the surface layer above the 4 K/m threshold in 26 % of the hours, and almost none of that is seen here — over grass the same vortex turns invisibly. At the Schwyberg it came from behind across a green alpine pasture.
And what none of this means. Altitude is no free pass: above 2000 m there is no station with a 5 cm sensor, so we simply could not check anything there — the statement "it is more harmless up high" applies to the pilot rule, not to reality. The global study even notes that dust devil maxima often lie in mountain regions [5]. One summer is not a climatology. And we have proven not a single dust devil; we have counted how often the ingredients were together.
And why the pilot rule and not the research criterion?
Because the analysis let the two run against each other — and the research criterion failed in this direct transfer to Switzerland. The research criterion hangs on a single quantity, the temperature jump above the ground. We held that quantity against 40,711 measured hours — and the model it comes from is too low in 86.5 % of the hours. It thus collects its hits almost exclusively where we could not check by measurement (rock above 2000 m), and stays silent in the valleys, where the measurements sound the alarm. The pilot rule manages without this quantity and additionally checks whether there is any dry, loose ground at all — the condition that the research criterion lacks entirely and that makes the difference in Switzerland.
That the study is therefore bad does not follow from this: it is built for deserts, its thresholds come from southern Morocco, and there dry, loose ground is a given. Just not here.
Dry summer, blue sky, hardly any wind, around midday? Brake handles in your hands early.
Limitations of this analysis
- The measurements cannot check the high-alpine finding. Of the 74 stations with a 5 cm sensor, none lies above 2000 m. Whether the model is right up there is open — we have not refuted it, we could not test it.
- The pilot rule is calculated incompletely. Of its five conditions, four are in our analysis; the fifth — a temperature drop of more than 0.7 °C/100 m — needs data on several pressure levels, which are available for only around 12 of the 69 days. All the A values in this article are therefore too high rather than too low.
- The numerical thresholds of the pilot rule are our choice. Apart from the temperature gradient, the DHV names no figures [1]; we set 700 W/m², 0.10 m³/m³ and 40 % from the percentiles of our data, and the wind limit of 7 m/s (25 km/h) takes over the documented upper limit from the literature [5]. Other thresholds would give other percentages — what is robust is the comparison of the two lists and the direction, not the decimal place.
- Measuring stations are not launch sites. SwissMetNet sits at airfields and on valley floors; transferring the model error to launch sites is an assumption.
- The model error is described, not explained. The 1 km averaging as the cause is plausible and unproven.
- Hourly means smooth everything away, and one summer is not a climatology. A vortex lives less than a minute — we have proven not a single dust devil, we are counting favourable conditions. And 69 days in 2026 are not a statistic; a wet summer would look different.
- On the trend we say nothing. The SHV/FSVL states that dust devils are becoming more frequent because of climate change [11]. Plausible — but it cannot be checked with one summer. That would take the same calculation over twenty years.
Frequently asked questions
What is a dust devil? A vortex of air close to the ground, rotating fast about a vertical axis, driven solely by strongly overheated ground. In German Staubteufel or Heuteufel, in meteorology a Kleintrombe (small whirlwind). In Central Europe it usually lasts less than a minute and rarely reaches higher than 100 m [2].
How do I recognise a dusty day? By five quantities that have to come together: plenty of sun, dry ground, dry air, light wind and a strongly overheated surface layer. The most critical window is 12:00 to 16:00 with a maximum around 13:00, most likely in low, dry locations.
Above what wind strength do dust devils stop forming? The literature names roughly 7 m/s (25 km/h) of ambient wind as the practical upper limit [5]; above that the vortex is usually sheared off before it builds up. Conversely, dead calm is not the safest state: the initial rotation often comes from a gust or from a slight lee. What is critical is light wind without a clear direction.
Are there dust devils in Switzerland at all? Yes — and they injure people. On 2 July 2025 an experienced pilot at the Schwyberg (FR) was caught by an invisible dust devil on a grassy launch site and severely injured [12]. Our analysis of the measurements shows: in 26 % of the analysed measured hours the surface layer was steeper than 4 K/m, most markedly in the Rhône valley and in the lowlands. But a vortex only becomes visible over sand, gravel or a harvested field.
Are dust devils increasing in Switzerland? The SHV/FSVL assumes so: longer heat periods and drier soils favour them [11]. Our analysis can neither confirm nor refute it — it covers a single summer.
Why is a dust devil dangerous for paraglider pilots? Because it turns. On one side of your wing the air runs with you, on the other against you — in an idealised model calculation, roughly 69 km/h of difference across 10 metres of span. The consequence is often a massive collapse close to the ground [1].
What do I do when one comes towards the launch site? Do not unclip; throw yourself onto the wing immediately, gather up the leading edge and cover it with your body. Never gather the wing by the lines and never hold an empty wing by the risers [1].
Sources and reproducibility
- [1] DHV — Sicherheit und Technik: Dust Devil Info, July 2020, by Volker Schwanitz, Karl Slezak and Lucian Haas. PDF, dhv.de
- [2] DHV-info 186 (2014), Volker Schwanitz: Dust-Devils, pp. 68–69. PDF, dhv.de
- [3] Deutscher Wetterdienst, Wetterlexikon: Staubteufel. dwd.de
- [4] Swiss Severe Weather Archive: Tornados — distinction from small whirlwinds. sturmarchiv.ch
- [5] Jemmett-Smith, B. C., Marsham, J. H., Knippertz, P. & Gilkeson, C. A. (2015): Quantifying global dust devil occurrence from meteorological analyses. Geophysical Research Letters 42(4), 1275–1282. doi.org/10.1002/2015GL063078 — the thresholds tested there come from Oke et al. (2007) / Ryan (1972) for 4 K/m and the 7 m/s wind upper limit, and from Ansmann et al. (2009, SAMUM campaign, southern Morocco) for 8.5 and 10 K/m. The study calculates global potential (favourable hours), not observed individual events
- [6] Giersch, S. & Raasch, S. (2023): How Do Dust Devil-Like Vortices Depend on Model Resolution? Boundary-Layer Meteorology 187, 703–742. doi.org/10.1007/s10546-023-00792-3
- [7] Jackson, B. (2019): On the Relationship between Dust Devil Radii and Heights. arXiv:1910.14135 — contains the derivation after Rennó, Burkett & Larkin (1998)
- [8] MeteoSwiss, Open Government Data: SwissMetNet hourly values. data.geo.admin.ch
- [9] Swiss Severe Weather Archive: Staubteufel Schüpfheim, 30.05.2012 — sighting on a sand pitch, with photos and video. sturmarchiv.ch
- [10] Lucian Haas, lu-glidz (2018): Meteowissen: Dust Devil. lu-glidz.blogspot.com
- [11] Roger Oechslin, meteorology officer SHV/FSVL: Tückische Teufel — „Dust Devils" erkennen und einschätzen. Swiss Glider no. 4, July/August 2026, pp. 22–27. Online for SHV/FSVL members: shv-fsvl.ch
- [12] SHV/FSVL Human Factors working group: My Air Lesson — Plötzlich im Strudel. Interview with Beat Zahno on the Schwyberg accident of 2 July 2025. Swiss Glider no. 4, July/August 2026, pp. 18–21: shv-fsvl.ch
Recalculating: all figures come from four scripts that fully reproduce the data retrieval and the analysis — model retrieval for the 494 launch sites, analysis of the pilot rule and the research criterion including a sensitivity calculation and altitude filter, analysis of the measured surface gradients at the SwissMetNet stations, and the paired comparison of model against measurement. Confidence intervals are Wilson score intervals at the 95 % level, calculated at the hourly level — the temporal dependence of neighbouring hours is not accounted for in them, so the intervals are rather too narrow. We supply the scripts and the aggregated data on request. An earlier version compared the model hit rate at the launch sites directly with the measured hit rate at the stations — inadmissible, because the two samples lie at different altitudes. The paired comparison replaces it; the finding comes out even clearer. The archived model dataset comes from the retrieval of 17.08.2026 via the Historical Forecast API (fixed date range 28.05.–04.08.); the wind limit of the pilot rule was switched to the documented literature value of 7 m/s in the process. A fifth script recalculates the analysis with varied parameters: the direction and the size relationships of all findings reproduce, while the absolute percentages shift slightly, because the archived model state of the retrieval API is not stable to the bit.
How Wingcast helps you with this
Honestly: Wingcast cannot forecast a dust devil for you. Nobody can. A vortex 20 m in diameter with a lifetime of 40 seconds lies orders of magnitude below what a forecast model resolves.
What a weather product can deliver is the stage before that: working out whether today is such a day. Strong radiation, dry ground, dry air, light wind, a steep surface layer — these are quantities that appear in the data, and Wingcast evaluates them daily for every Swiss launch site.
But the analysis also shows how careful you have to be with that. An established criterion from the scientific literature points, in Switzerland, at sunlit high-alpine rock, where there is nothing to be whirled up. The rule of thumb that pilots use at the launch site hits closer — and the measured values confirm it. A number is not right just because it comes out of a model.
That is why we stick to what we say everywhere: physics calculates, you decide. The data tell you whether you should be especially attentive today. Whether the vortex is running towards your launch site right now, you see from the rushing in the trees, from the windsock, from the grass in the air — and from nothing else.
→ What a gust front looks like when measured — and what the model said about it → Recognizing foehn: why 4 hPa is not enough → All meteorology topics → Thermal forecast Switzerland: today, tomorrow and the day after for every launch site → Flying weather Switzerland today: situation, warnings and thermals for the next three days → Open Wingcast for free and check your spot
As of: 17 August 2026 · Author: Wingcast. This text is meteorology, not a clearance to fly. You check the conditions and decide for yourself.