Gust front of 30 July 2026: what the model said — and what was measured
WingcastUpdated 2026-08-0325 min read
TL;DR — On 30 July 2026 a dry gust front crossed Switzerland: gusts measured up to 121 km/h, while according to the forecast the air mass was too dry to form the shelf cloud that serves as a warning. We put two data sets from the same day side by side — the ICON-CH1 forecast for 494 launch sites and the ten-minute values measured by 139 SwissMetNet stations. Both show the same pattern: the effect falls off sharply with altitude. But they disagree about where it stops. The forecast still saw the signature at 3'169 m; in the measurements, using our standard criteria, it appeared at none of the 16 stations above 2'000 m. The highest station with the complete front signature was Grimsel Hospiz at 1'980 m. That is the result for this one day — no general statement about gust fronts can be derived from it. For flight planning it means two things: on that day the front stayed low, and model gust values at altitude want reading with care.
A great deal gets written about gust fronts. What is missing are numbers for one concrete day. This article takes a real event — 30 July 2026 in Switzerland — and analyses it twice: once from the forecast we work with every day, and once from real station measurements. The two analyses do not say the same thing, and that is precisely the interesting part.
What a gust front is
Germany's national weather service (DWD) lists the gust front in its weather glossary as a "line-shaped mesoscale convective system" — in plain terms: a band of thunderstorms or showers, a few tens to a few hundred kilometres long (that is what "mesoscale" means; "convective" means: driven by rising air). The glossary describes the passage by four features [2]:
- The wind shifts — by up to 180 degrees, so afterwards it can come from the opposite direction.
- The pressure rises, by 3 to 5 hectopascals — that is the unit on the barometer; behind it is the heavier cold air, which presses down harder on the ground.
- The temperature falls, by 5 to 10 degrees.
- The wind reaches up to gale or hurricane force — from about 75 and 118 km/h respectively.
The glossary states explicitly that the term is also applied to cold fronts with strong gusts without thunderstorms [2].
These three features — wind shift, pressure rise, temperature drop — are also the detection criterion we work with below. We set the thresholds considerably lower than the DWD guide values, however, in order to catch weaker passages too. The glossary covers two phenomena with the one term: the entire thunderstorm system — and the pure gust passage without a thunderstorm. This article is about the second.
For pilots, the formation can be told in five steps:
- There is a thunderstorm — somewhere. Usually far away from you, often outside anything you can see from the launch site at all.
- The falling air turns cold. Precipitation falls out of the thunderstorm and drags air down with it — the technical term for this descending air is downdraught. On the way, part of the drops evaporate and the ice particles melt. Both require heat, and the air takes it out of itself: it cools down. The DWD puts it like this: "Through the evaporation of water drops as well as through the melting and sublimation of ice particles, the air in the downdraught is strongly cooled" [1]. (Sublimation means: ice turns straight into water vapour, without melting first.) The drier the surrounding air, the more evaporates — and the more powerful the descending air becomes: then "evaporation processes in the dry air mass can markedly accelerate the downdraughts in the area of a thunderstorm" [4].
- At the ground it spreads out flat. Cold air is heavier than warm air, so it keeps falling faster — until it touches down and can go no further. Then it flows away sideways, rather like water tipped onto a table: "Since cold air is heavier than warm air, the downdraught is accelerated on its way down until the air flows out horizontally at the ground" [1]. What collects down there is a shallow lake of cold air — in the jargon, the cold pool.
- The cold pool outruns the thunderstorm. As long as the wind changes strongly enough with height — technical term: wind shear — the pool stays underneath the thunderstorm and the two travel on together. But if the pool grows too large, it pushes out ahead under the warm air, and the thunderstorm loses its warm inflow: "the cold pool increasingly flows into the warm-air region ahead of it and the squall line is in its dissipation stage" [1] (squall line = the line of thunderstorms). The leading edge of the cold air travels on, the thunderstorms are left behind.
- What arrives at your site. Where this leading edge finally passes through, nothing is left of the thunderstorm that created it — all that arrives is fast-moving air. (That is how the DWD describes it [1]. Our measured passage below fits this picture, but does not prove the origin — see the limitations.)
Cross-section
From the thunderstorm to the detached cold air
How strong was this case compared with the textbook?
For the passage of a gust front the DWD gives a temperature drop of "mostly within a few minutes by 5 to 10 degrees or more" [1], and in the weather glossary 5 to 10 degrees together with a pressure rise of 3 to 5 hectopascals [2].
Our case stayed below that. At the SwissMetNet stations the strongest temperature drop within half an hour was 3.2 kelvin in the median; only 8 out of 146 stations reached 5 kelvin or more. Taken across the whole evening, by contrast, the change of air mass was pronounced: from the afternoon maximum to the evening minimum 13.5 kelvin in the median, 19.1 kelvin in the most extreme case.
At the passage, then, the front was thermally weaker than the textbook case, but the air mass behind it was clearly colder. That is also why we set lower thresholds for detection than the DWD guide values — with 5 kelvin as the criterion we would have found almost nothing on that day.
Why are some gust fronts visible and others not?
At the leading edge, the outflowing cold air pushes in under the warm air ahead of it and lifts it. If that air is moist enough, the water vapour condenses as it rises — and you see the shelf cloud: a dark, roll-shaped cloud that rolls along ahead of the thunderstorm. The DWD describes its formation like this: where the inflowing updraught and the cooled downdraught meet, a horizontal rotation develops, and "since the water vapour of the updraught condenses in the process, the roll-shaped cloud forms" [3]. It is the classic warning sign — you see the front coming before it is there.
Dry air changes two things about this, and both work in the same direction:
The front gets stronger. The drier the air, the more precipitation evaporates on the way down and the colder and heavier the descending air becomes. That is exactly the reason the DWD gives for the fact that "evaporation processes in the dry air mass can markedly accelerate the downdraughts in the area of a thunderstorm" [4].
The front becomes invisible. The shelf cloud arises solely through condensation. Without the moisture, nothing condenses — then no cloud forms, even though the front below it is there unchanged.
So the very property of the air that makes the front harder also takes away its visible warning sign. The weather glossary notes that shelf clouds are "not always encountered" [3] — without naming dryness as the reason.
30 July 2026
An event analysis that circulated in pilot circles that evening attributes the Swiss evening wind to the cold-air outflow of powerful thunderstorms over France. That is a plausible reading, and it fits the mechanics — but our data cannot prove it. We see the front crossing Switzerland, not its origin. What this article shows is the passage and its dependence on altitude; where the wave came from is an attribution that would need other data.
The air mass in which the front travelled was dry. At the hour of the strongest gusts, low cloud was at 0 % in the median — at 308 of the 494 launch sites it was exactly zero (forecast values). According to the model, the moisture for a shelf cloud was missing.
One honest qualification: "blue sky" would be wrong. Total cloud cover was around 87 % in the median — high cirrus. The correct statement is: at gust-front level there was nothing to see.
How fast does the wind rise in a gust front?
This is where forecast and measurement part company for the first time.
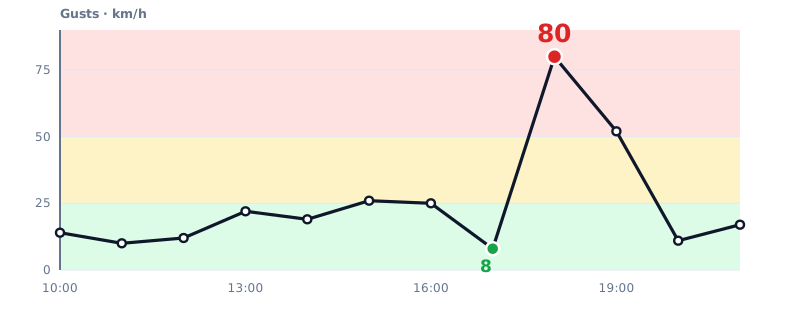
In the forecast the wind jumped between two hourly values: at the Euthal launch site (946 m) from 8 km/h at 17:00 to 80 km/h at 18:00. 25 of the 494 launch sites showed the same jump within one hour, 128 gained more than 40 km/h.
ICON-CH1 forecast · Euthal launch site · 946 m
From 8 to 80 km/h in one hour
In the measurements this can be resolved more finely — SwissMetNet delivers ten-minute values. From the last calm value to the peak took 40 minutes in the median; the fastest case managed it in 10 minutes, the slowest needed 110. Important: that is the duration of the rise itself, not a warning time — you only see when it begins once it has begun. And in the fastest measured case only ten minutes lay between calm wind and the peak. If you plan, plan for the fast end, not for the median.
On method: the rise counts as the span from the last value below 35 % of the peak up to the peak. At 5 of the 45 stations no such calm starting value could be found — the figure rests on the remaining 40.
The front ran eastwards — measured, not modelled
The times of the signature at the measuring stations produce a clean chain right across the country (local time):
| Time | Station | Altitude |
|---|---|---|
| 14:50 | Delémont | 439 m |
| 15:00 | Genève / Cointrin · Aigle | 411 m · 381 m |
| 15:40 | Bern / Zollikofen · La Brévine | 553 m · 1'050 m |
| 16:20 | Beznau | 326 m |
| 16:40 | Interlaken | 578 m |
| 17:00 | Zürich / Kloten | 426 m |
| 17:10 | Schaffhausen | 438 m |
| 17:20 | Meiringen | 589 m |
From west to east, over two and a half hours. A local effect such as valley wind or lake breeze does not produce a pattern like that.
How high does a gust front reach?
We analysed both data sets with the same method. A location only counts as hit by the front if three features occur at the same time: a gust jump of at least 15 km/h, a temperature drop of at least 1 kelvin and a pressure rise of at least 0.2 hectopascals — all three within the same window (measurement: 30 minutes, forecast: one hourly step). This combination is the signature of a change of air mass — ordinary gradient or valley wind does not as a rule produce it. What the signature does not distinguish: whether behind the change lies a thunderstorm outflow or a shallow cold front. The DWD glossary puts both under the term gust front [2]; for the altitude question the origin plays no part, and we leave it open (see the limitations).
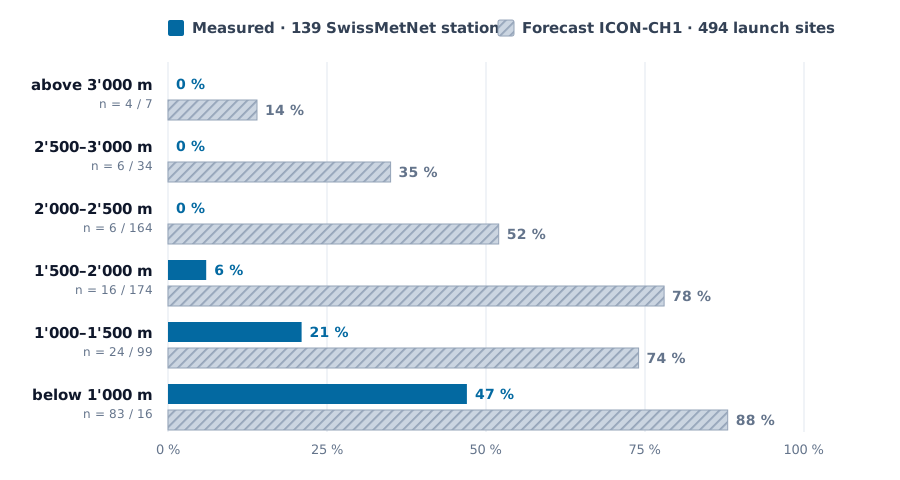
The answer from the measurements for this day: above roughly 2'000 metres the front was barely detectable. Of 139 SwissMetNet stations, 45 showed the complete signature. Below 1'000 m it was just under half of the stations, between 1'000 and 1'500 m still a fifth, between 1'500 and 2'000 m a single one out of sixteen. Above 2'000 m: none of the 16 stations — with deliberately relaxed criteria, two, the highest of them at 2'668 m. With our standard thresholds the highest station with a complete signature was Grimsel Hospiz at 1'980 m. High stations certainly did have wind on that day. The SwissMetNet station Piz Corvatsch at 3'294 m reported a peak gust of 78 km/h, and in the half-hour window with the strongest rise the wind there gained 43 km/h. What was missing in precisely that window was the change of air mass: the measured temperature fell by 0.4 kelvin, the air pressure rose by 0.1 hectopascals — both below the thresholds of 1 kelvin and 0.2 hectopascals from which we speak of a density current. That was upper wind, not the front.
On that day, then, the gust front was a near-surface phenomenon. Whether that holds for gust fronts in general cannot be concluded from a single case — that would take several analysed events.
Share with the complete front signature
Where the front stopped — measurement against forecast
How robust is this finding?
Three checks that a band table alone does not provide.
1 · Is it the altitude or the location?
High measuring stations stand on summits and passes, low ones on the Mittelland, in the Jura and on valley floors. So the missing signature up high could simply be down to the front never arriving there horizontally at all. The station list already argues against that: the front did indeed run into the interior of the Alps — Grimsel Hospiz, Göschenen, Engelberg, Meiringen, Chur, Andeer, and by 22:10 into the Bergell.
It becomes clearest at pairs of stations that stand practically in the same place — only at different altitudes (distance 5 to 8 km, altitude difference 1'300 to 2'000 m). The table shows, for each station, the 30-minute window of its strongest gust jump; in bold is the valley station of each pair:
| Station (altitude) · time | Gust jump | Temperature | Pressure |
|---|---|---|---|
| Göschenen (950 m) · 18:40 | +17 km/h | −1.8 K | +0.8 hPa |
| Gütsch, Andermatt (2'286 m) · 14:00 | +19 km/h | +1.6 K | −0.1 hPa |
| Montagnier, Bagnes (839 m) · 16:10 | +26 km/h | −2.1 K | +0.3 hPa |
| Les Attelas (2'734 m) · 17:20 | +14 km/h | −1.5 K | 0.0 hPa |
| Engelberg (1'036 m) · 17:50 | +27 km/h | −1.5 K | +0.6 hPa |
| Titlis (3'045 m) · 19:30 | +17 km/h | +1.6 K | −0.2 hPa |
| Luzern (454 m) · 17:50 | +28 km/h | −2.5 K | +1.1 hPa |
| Pilatus (2'105 m) · 17:20 | +26 km/h | −2.5 K | 0.0 hPa |
| Andeer (987 m) · 21:40 | +31 km/h | −1.0 K | +0.3 hPa |
| Piz Martegnas (2'668 m) · 21:20 | +22 km/h | −0.9 K | +0.1 hPa |
Five times the same picture: down below, all three features cross the thresholds — gust jump, temperature drop, pressure rise. A few kilometres away and 1'300 to 2'000 metres higher, at least one is missing every time. On the Titlis and on Gütsch the temperature even rose by 1.6 kelvin, the opposite of a cold-air passage. And strikingly: at all five mountain stations the pressure rise was missing — which fits a shallow layer of cold air whose extra weight only reaches the barometer below its upper boundary. "The front was not in that area" therefore does not hold up — it was five kilometres away, with the time on record.
We checked the same thing systematically via a corridor: only stations that stand at most 25 km from a station that registered the front. Of the 16 stations above 2'000 m, 12 meet this condition. Within that corridor, 0 out of 12 showed the signature, whereas below 1'000 m it was 39 out of 68. So the altitude effect does not disappear when the geography is controlled for.
The two explanations still cannot be fully separated. The DWD puts the depth of such a thunderstorm outflow at "as a rule only a depth of a few hundred metres" [5]. With a flow that shallow and that tied to the ground, "it was too shallow" is no different a statement from "it did not arrive up there" — in the measurements the two are the same thing: no change of air mass. And what happened in the free air above the valley floor at 2'500 metres is something surface stations cannot tell us anyway.
2 · What does "0 %" mean with 16 stations?
Not "never". The 95 per cent confidence interval (Wilson) for 0 out of 16 runs from 0 to 19 per cent. We observed no case; we cannot rule out a rate of up to almost 20 per cent.
3 · Does the result hang on our thresholds?
Partly — and that is the most important limitation. The criteria (15 km/h, 1 kelvin, 0.2 hectopascals) are chosen by us, not taken from the literature. We therefore varied them — relaxed means 10 km/h · 0.5 K · 0.1 hPa, strict means 20 km/h · 2 K · 0.5 hPa:
| Thresholds | below 1'000 m | above 2'000 m | highest case |
|---|---|---|---|
| relaxed | 50/83 | 2/16 | 2'668 m |
| standard | 39/83 | 0/16 | 1'980 m |
| strict | 14/83 | 0/16 | 1'089 m |
What is robust is the trend, not the upper limit. In all three variants the share of affected stations falls off sharply with altitude. But the exact figure "up to 1'980 m" holds only for our middle threshold — with relaxed criteria two cases turn up as high as 2'668 m. The defensible formulation is therefore: above 2'000 m the signature was, on that day, either not detectable at all or only in isolated cases.
And what did the forecast say?
Something different. In the table, Measured stands for the 139 SwissMetNet stations and Forecast for the 494 launch sites from ICON-CH1:
| Altitude | Measured | Forecast |
|---|---|---|
| below 1'000 m | 47 % · n = 83 | 88 % · n = 16 |
| 1'000–1'500 m | 21 % · n = 24 | 74 % · n = 99 |
| 1'500–2'000 m | 6 % · n = 16 | 78 % · n = 174 |
| 2'000–2'500 m | 0 % · n = 6 | 52 % · n = 164 |
| 2'500–3'000 m | 0 % · n = 6 | 35 % · n = 34 |
| above 3'000 m | 0 % · n = 4 | 14 % · n = 7 |
| highest case | 1'980 m | 3'169 m |
Both data sets point the same way: the effect decreases with altitude. But the forecast sees the front reaching around 1'200 metres higher than it was measured (both values determined with the standard criteria). The peak values, too, are some way apart — the model's highest figure was 112.7 km/h (Palfries, 1'746 m), while 121.3 km/h was measured on the Chasseral (1'594 m).
The absolute percentages are deliberately not directly comparable: measuring stations do not stand where launch sites lie, and the time windows differ. The two maxima also come from different samples in different places — what is comparable there is the order of magnitude, not the individual value. What is defensibly comparable are the shape of the curve and the upper limit. And there the difference is clear.
What follows from this case — and what does not
Everything that follows is the conclusion for this one event: for what 139 SwissMetNet stations measured on 30 July 2026. It is not a general statement about gust fronts. Whether other cases behave the same way, we do not know — that would require analysing further events in the same manner.
On that day the hard hit was down low, not up high. That is counter-intuitive; most people would expect it to be worse at altitude. A single day does not tell us whether that is the rule or the exception.
On that day the forecast was too high at altitude. When a model shows a thunderstorm gust at a high-lying launch site, that need not mean the front arrives there. Why the forecast was too high up top, we do not know for certain — plausible but unproven is that a model can only represent the shallow, sharply bounded cold air in smoothed form, and that the gust diagnostics at high grid points reflect the strong upper wind instead. The practical pointer stays the same: read the number with care. Nor can a systematic error be derived from one day; that would take a series of cases.
And what none of this means: altitude is no free pass. The analysis says that the front did not reach high on that day — not that it was calm up there. On the Chasseral (1'594 m), 121.3 km/h was measured. Turbulence above the front, shear at its upper boundary and ordinary upper wind are subjects of their own, and these data say nothing about them.
What you take from this for flight planning
- A gust front can arrive far from where it formed. The chain we measured ran right across the country in two and a half hours — further than you can survey from a launch site. Thunderstorms far upwind are therefore no reason to sound the all-clear.
- The absence of a shelf cloud is not a safety sign. If the air is dry, it is missing — and the front is then, if anything, stronger.
- The rise is fast, in extreme cases very fast. Measured, it took 10 to 110 minutes, 40 in the median. Rely on the fast end, not on the average — and the rise itself is the only warning.
- The timing is fuzzier than the fact. Your landing time belongs ahead of the expected window, not inside it.
- A single station value is not enough. In the fastest measured case, ten minutes lay between calm wind and the peak — anyone checking a station only once an hour sees the rise only once it has happened.
Thunderstorms far upwind? Land early.
Limitations of this analysis
- There are only 16 stations above 2'000 m. "No signature" means: not at those 16. The 95 per cent interval leaves a rate of up to 19 per cent open.
- The criteria are our own choice. 15 km/h, 1 kelvin and 0.2 hectopascals do not come from the literature but from us. The altitude trend withstands every variant tested, the exact upper limit does not.
- Measuring stations are not launch sites. SwissMetNet stands on airfields, on valley floors and on exposed ridges — not where paragliders take off. The exposure differs.
- The two data sets are built differently. 139 stations against 494 launch sites, 30-minute windows against hourly steps, measurement against forecast. The absolute percentages are therefore not to be set off against one another — the altitude dependence and the upper limit are.
- The 13.5 kelvin of evening cooling also contain the ordinary evening cooling. On a clear summer evening it cools down markedly even without a front; how much the new air mass contributed could only be separated cleanly with a comparison day.
- One day is not a climate. These numbers describe 30 July 2026 — a cleanly documented individual case, not a statistic about gust fronts in general.
- What we did not measure: the turbulence above the front. The stations stand at the ground. About shear and lifting in the free atmosphere these data say nothing.
- And we have not proven the origin. That the wave came out of French thunderstorms is an attribution taken from someone else's analysis. Our data show the passage across Switzerland — not where it began.
Frequently asked questions
How high does a gust front reach? In the one case we have analysed with measured values — 30 July 2026 in Switzerland — it was barely detectable above roughly 2'000 metres. Of 139 SwissMetNet stations, 45 showed the complete signature of gust jump, temperature drop and pressure rise: below 1'000 m just under half, between 1'500 and 2'000 m one out of sixteen, above 2'000 m not a single one (with relaxed criteria two, up to 2'668 m). The highest station with the full signature lay at 1'980 m. That describes this event; it is not a universally valid upper limit for gust fronts.
Can a gust front arrive without being seen? Yes. The visible shelf cloud only forms if the air is moist enough for water vapour to condense at the leading edge. If the air is dry, the cloud is missing — and the front tends to be harder, because of the stronger evaporative cooling.
How much warning time do I have? Measured at the stations that registered the front: from calm wind to the peak, 40 minutes in the median, 10 in the fastest case, 110 in the slowest. That is the duration of the rise, not a guaranteed warning time — when it begins is shown only by the rise itself. The frequently read claim that a gust front is "there within minutes" applied, on that day, only to the fastest portion of cases.
How do I recognise a gust front in the data? By three features that occur at the same time: a sudden gust jump, a temperature drop and a pressure rise. When all three come together, it is a change of air mass and not ordinary wind. The wind direction often turns with it, but not reliably: at the 45 stations with a signature the veer was 49 degrees in the median, and only 13 of them turned by more than 90 degrees. As the sole marker it is not good enough.
Does the weather forecast show a gust front reliably? It does show it — but not necessarily at the right altitude. On 30 July the ICON-CH1 forecast still saw the signature at 3'169 m, while it was measured only up to 1'980 m. Why, we do not know for certain; plausible but unproven is that the model can only represent the shallow, sharply bounded cold air in smoothed form. The warning was right — the vertical extent, on that day, was to be read with care.
Sources and reproducibility
Specialist sources (referenced as [1]–[5] in the text) — DWD quotations translated from the German by us:
- [1] Deutscher Wetterdienst, Thema des Tages — Kleine Gewitterkunde, Teil 5: Die Squall-Line (Gewitterlinie), Dr. rer. nat. Markus Übel, Vorhersage- und Beratungszentrale Offenbach, 10.09.2023 → dwd.de/DE/wetter/thema_des_tages/2023/9/10.html
- [2] Deutscher Wetterdienst, Wetterlexikon: Böenfront → dwd.de — glossary Böenfront
- [3] Deutscher Wetterdienst, Wetterlexikon: Böenwalze → dwd.de — glossary Böenwalze
- [4] Deutscher Wetterdienst, Thema des Tages — Erst grosse Hitze, dann schwere Gewitter?, M.Sc. Nico Bauer, 29.07.2026 → dwd.de/DE/wetter/thema_des_tages/2026/7/29.html
- [5] Deutscher Wetterdienst, Thema des Tages — Die Böenfront eines Gewitters und ihre Folgen, Dipl.-Met. Helge Tuschy, 31.05.2017 → dwd.de/DE/wetter/thema_des_tages/2017/5/31.html
Data:
- Measurements: MeteoSwiss Open Government Data, SwissMetNet, ten-minute values from 30 July 2026 — peak gust (1-second gust), air temperature at 2 m, air pressure at barometer level. 146 stations outside Ticino delivered data; 139 of them could be used for the signature analysis (gust, temperature and pressure series complete), the temperature statistics use all 146.
- Forecast: ICON-CH1 (MeteoSwiss) via Open-Meteo, 494 Swiss launch sites, 30 July 2026.
- Analysis: both data sets and the calculation scripts are archived and can be retraced.
How Wingcast handles this
Wingcast reads the weather models every morning for all 494 Swiss launch sites and writes in plain language what they mean for your launch site. This analysis is an example of how we handle our own data basis: recalculate, check against measurements and name the discrepancy instead of leaving it out. Wingcast is decision support — we deliver data and assessment, you make the decision.
→ Recognizing foehn: why 4 hPa is not enough → Thermal forecast Switzerland: today, tomorrow and the day after for every launch site → Flying weather Switzerland today: situation, warnings and thermals for the next three days